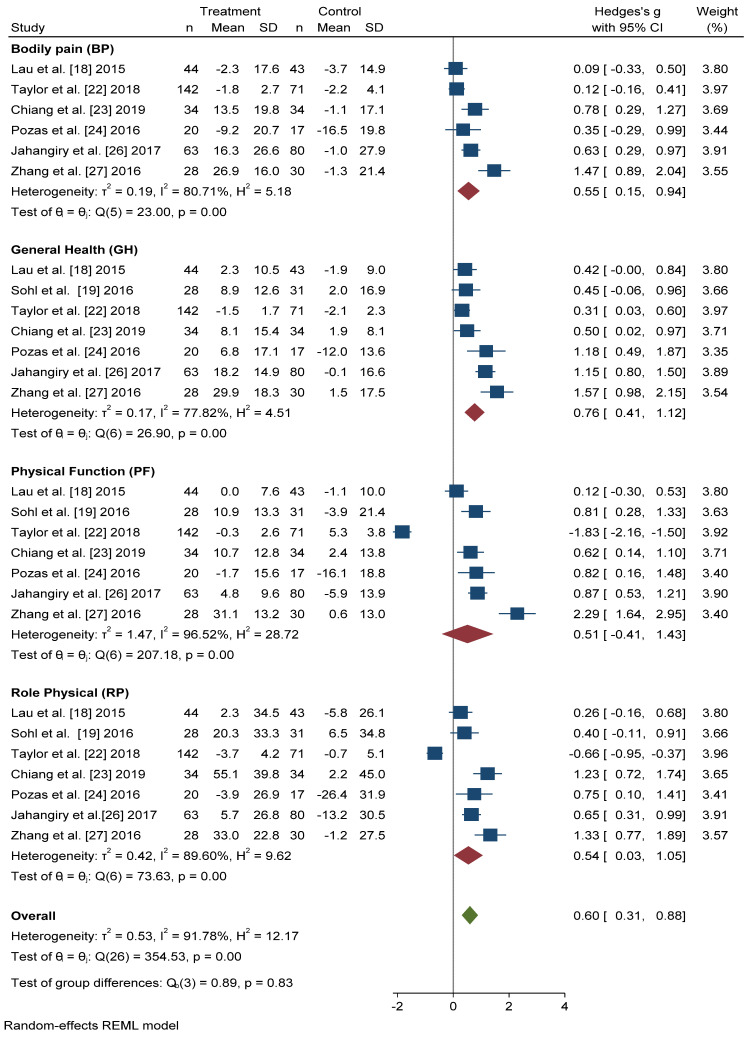
Figure 4.
Forest plot of the physical health scores. Blue navy square centered at the point estimate of the effect size, with a horizontal line extending on either side of the square, representing the 95% confidence interval of the point stimate. Red diamond represents a confidence interval for each dimensions and green diamond represents a confidence a confidence interval for the overall effect size. REML: Restricted maximum-likelihood.

