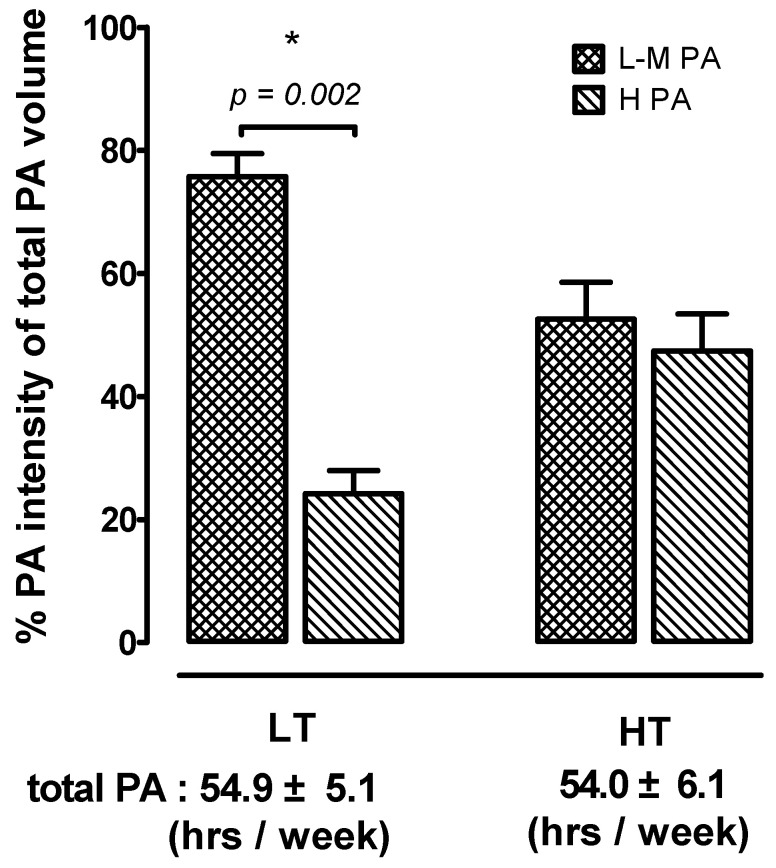
Figure 2.
Differences in physical activity time per week in LT and HT. Data are expressed as Mean ± S.E.M. * denotes a significant difference between L-M PA and H PA (p < 0.05). Low tennis time group (LT), high tennis time group (HT), physical activity (PA), low to moderate physical activity (L-M PA), high physical activity (H PA).

