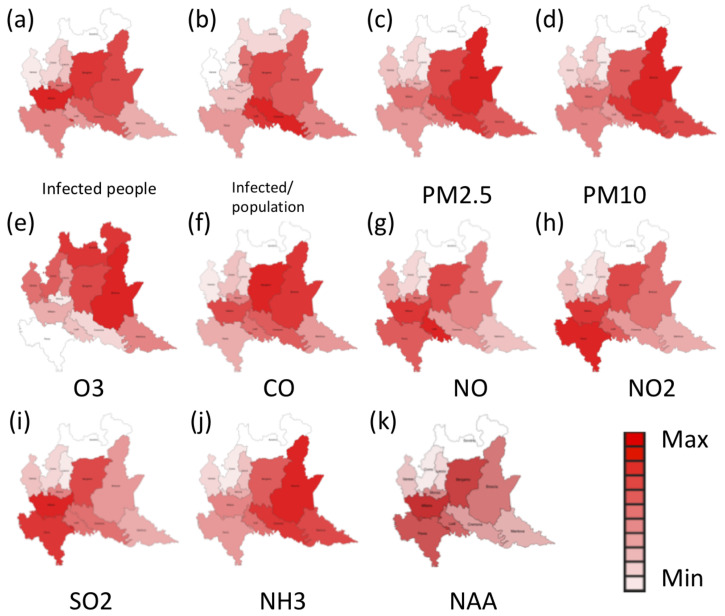
Figure 1.
Distribution over the different provinces of Lombardy of (a) total number of infected people, (b) daily prevalence rate (Infected /population), (c) average concentration of particulate matter 2.5 (PM 2.5), (d) average concentration of particulate matter 10 (PM10), (e) ozone (O3), (f) carbon monoxide (CO), (g) nitric oxide (NO), (h) nitrogen dioxide (NO2), (i) sulfur dioxide (SO2), (j) ammonia (NH3) and (k) net atmospheric acidity (NAA) during the considered time period.

