Abstract
Singular value decomposition-based clutter filters can robustly reject tissue clutter, allowing for detection of slow blood flow in imaging microvasculature. However, to identify microvessels, high ultrasound frequency must be used to increase the spatial resolution at the expense of shorter depth of penetration. Deconvolution using Tikhonov regularization is an imaging processing method widely used to improve spatial resolution. The ringing artifact of Tikhonov regularization, though, can produce image artifacts such as non-existent microvessels, which degrade image quality. Therefore, a deconvolution method using total variation is proposed in this study to improve spatial resolution and mitigate the ringing artifact. Performance of the proposed method was evaluated using chicken embryo brain, ex ovo chicken embryo chorioallantoic membrane and tumor data. Results revealed that the reconstructed power Doppler (PD) images are substantially improved in spatial resolution compared with original PD images: the full width half-maximum (FWHM) of the cross-sectional profile of a microvessel was improved from 132 to 83 μm. Two neighboring microvessels that were 154 μm apart were better separated using the proposed method than conventional PD imaging. Additionally, 223 FWHMs measured from the cross-sectional profiles of 223 vessels were used to determine the improvement in FWHM with the proposed method statistically. The mean ± standard deviation of the FWHM without and with the proposed method was 233.19 ± 85.08 and 172.31 ± 75.11 μm, respectively; the maximum FWHM without and with the proposed method was 693.01 and 668.69 μm; and the minimum FWHM without and with the proposed method was 73.92 and 45.74 μm. There were statistically significant differences between FWHMs with and without the proposed method according to the rank-sum test, p < 0.0001. The contrast-to-noise ratio improved from 1.06 to 4.03 dB with use of the proposed method. We also compared the proposed method with Tikhonov regularization using ex ovo chicken embryo chorioallantoic membrane data. We found that the proposed method outperformed Tikhonov regularization as false microvessels appeared using the Tikhonov regularization but not with the proposed method. These results indicate that the proposed method is capable of providing more robust PD images with higher spatial resolution and higher contrast-to-noise ratio.
Keywords: Deconvolution, Microvessel imaging, Power Doppler imaging
INTRODUCTION
Tissue backscatter signal reveals higher spatiotemporal coherence and power than blood signal and can be conveniently separated from blood signals in the domain of singular values. Through the use of ultrafast plane wave excitation and spatial–temporal filtering, a large number of power Doppler (PD) ensembles can be obtained to improve the detection of slow blood flow signals of small vessels for microvessel imaging. Recently, singular value decomposition (SVD)-based clutter filters (Mauldin et al. 2011; Demene et al. 2015; Song et al. 2017b) have been proposed and found to have superior blood signal detectability compared with conventional PD imaging. Although SVD-based clutter filtering is highly sensitive, a major drawback of the technique is the expensive computational cost associated with SVD calculations on a large number of ensembles. Therefore, we have proposed randomized SVD (Song et al. 2017b) and randomized spatial downsampling to speed up the SVD process; the real-time potential was reported in our previous study (Lok et al. 2018). Another issue of the ultrasound microvessel imaging (UMI) technique is the presence of background noise, which manifests as a ramp-shaped background noise profile (Song et al. 2017c), hampering flow detection performance. We have previously proposed an effective noise suppression method (Huang et al. 2019a, 2019b) to reduce background noise power, as well as a noise equalization method (Song et al. 2017a) to improve the image quality of UMI.
To further improve UMI performance in identifying small vessels, high ultrasound frequency is required, which increases spatial resolution at the expense of shorter depth of penetration. To minimize the trade-off between ultrasound frequency and penetration depth, we proposed using deconvolution to improve spatial resolution, which is well known in imaging or optical processing. The problem of deconvolution can be categorized into non-blind deconvolution and blind deconvolution. The difference between these two is knowledge of the system point spread function (PSF). In the present study, we focused on non-blind deconvolution to improve spatial resolution.
The simplest way to apply non-blind deconvolution is through inverse filtering. In the inverse filtering method, an inverse filter is used to eliminate the effect of the PSF to achieve object function. For PD imaging, the relationship between the object x(i,j) and received PD image y(i,j) at location (i,j) is
| (1) |
where p(i,j) and n(i,j) are the required PSFs of the PD image and background noise at location (i,j), respectively. The matrix form can be written as
| (2) |
where x is the object PD image, y is the ultrasound PD image, n is the background noise and A is the linear convolution operator (Toeplitz matrix), which consists of the PD PSF. In inverse filtering, the inverse matrix of A is applied to the PD image. However, background noise will be enhanced by directly applying the inverse matrix. For this reason, a non-blind deconvolution algorithm based on Tikhonov regularization (Rangarajan et al. 2008) has been proposed to mitigate the background noise enhancement through choice of the appropriate regularization parameter. This has been reported to improve spatial resolution in ultrasonic imaging (Jensen et al. 1993). The cost function of Tikhonov regularization can be expressed as
| (3) |
where and y are the reconstructed image and original image, respectively. and σ are the L2 norm and regularization parameter, respectively. Tikhonov regularization provides a closed analytic matrix form for deconvolution, which can be expressed as
| (4) |
where (.)H and (.)−1 are the complex conjugate transpose and matrix inversion. In addition, the reconstruction can be optimized by using the fast Fourier transform-based method. However, the major disadvantage of Tikhonov regularization is the ringing artifact, which is problematic in ultrasound PD imaging, because the reconstructed PD image will reveal blood vessels that do not exist in the original image.
To reduce the ringing artifact, total variation (TV) regularization (Dey et al. 2006; Yang et al. 2016) was adopted in this study because of its good edge preservation in the field of image processing. In this study, we used the primal–dual model (Chambolle and Pock 2011) to solve the TV-constraint problem to mitigate the ringing artifact and improve UMI spatial resolution. The proposed method was used on the PD images of chicken embryo brain, chorioallantoic membrane (CAM) and chicken embryo tumor data to determine the improvement in spatial resolution and detectability of small vessels.
METHODS
Deconvolution using primal–dual algorithm with TV
The cost function of deconvolution using TV regularization can be expressed as
| (5) |
where x and y are the reconstructed PD image and input PD image, respectively. A is the linear convolution operator of the required UMI PSF. ‖p‖1 and are the L1 and L2 norms of p, respectively. λ is the regularization parameter. D is the finite difference operator consisting of horizontal and vertical finite differences and is known as the regularization kernel. The iteration method can be optimized by using the fast Fourier transform-based method iteratively as described in Chambolle and Pock (2011).
Ultrasound imaging of chicken embryo brain, CAM and tumor
To image the chicken embryo brain and CAM, a Verasonics Vantage 256-channel ultrasound system (Verasonics Inc., Kirkland, WA, USA) equipped with an L35-16 vX high-frequency linear array transducer (Verasonics Inc.) operating at a center frequency of 25 MHz was used for scanning. Fifteen-angle compounding plane-wave imaging was performed (−7° to 7°, step angle = 1 °), and the transmit voltage was set as 40 V (one-side voltage). The post-compounded frame rate was nearly 500 Hz. A total of 200 ensembles were used to construct the output PD image. In-phase quadrature phase (IQ) data were first captiued from a chicken embryo (brain and CAM data). To image the chicken embryo tumor, the same settings were used, and IQ data were captiued from another chicken embryo with the injection of renal cell carcinoma that was generated with Renca cancer cells (Huang et al. 2019a, 2019b). The deconvolution process was conducted on a workstation with Intel Gold 6130 2.1 GHz CPU and 32 GB RAM running MATLAB. No IACUC approval was necessary to perform the chicken embryo experiments described in this article, because avian embryos are not considered to be live vertebrate animals according to National Institutes of Health (NIH) public health service policy.
Point spread function estimation
Lumason microbubble (MB) suspension (Bracco Diagnostics Inc., Monroe Township, NJ, USA) was diluted with saline to approximately 1/1000 times the original concentration in a water tank. The same ultrasound system, center frequency and compounding angles were used in this experiment. Then, an SVD-based clutter filter was applied to the IQ data to extract MB signals. A threshold was set to the clutter-filtered IQ data to suppress background noise signals. A system PSF was derived based on observed MB signal dimensions and shape ((FWHM in Fig. 1a). A multivariate Gaussian model was used to fit the PSF observed from the MB signals in different locations, as illustrated in Figure 1b. Finally, the required PSF of the PD image can be derived by computing the square of the system PSF, as illustrated in Figure 1c.
Fig. 1.
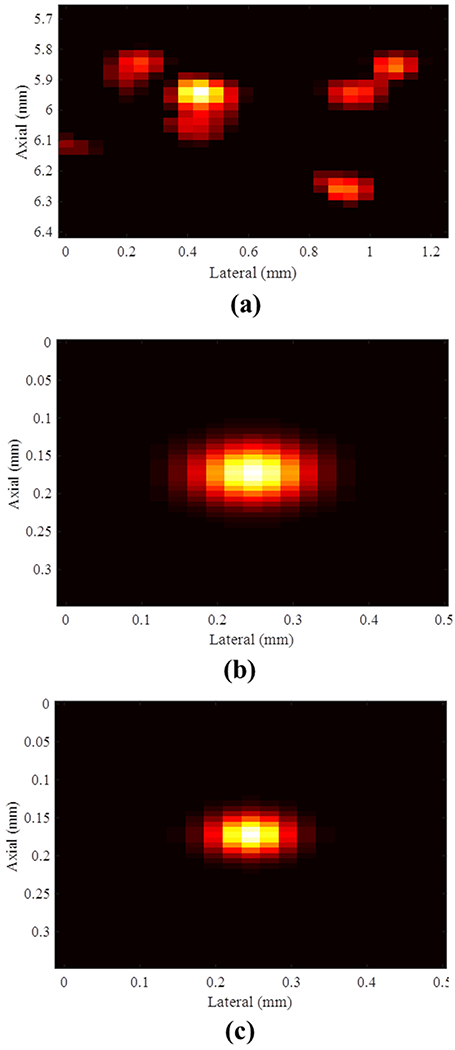
(a) Received microbubble signals, (b) estimated system point spread function using a multivariate Gaussian model and (c) estimated ultrasound microvessel imaging point spread function for the power Doppler image.
Vessel phantom
To illustrate the utility of the proposed method at clinically relevant frequencies, a clinical linear array transducer 9 L-D (General Electric Healthcare, Wauwatosa, WI, USA) operating at a center frequency of 6.25 MHz was used to image a customized vessel phantom (Gammex, Middleton, WI; diameter = 2 mm). Ten-angle plane-wave compounding imaging was used (−5° to 4°, angle step = 1°), and the post-compounding frame rate was 500 Hz. The number of ensembles was 200, and the flow speed was set at 10 mm/s.
Ultrasound data processing and evaluation metric
After IQ data for a chicken embryo were acquired, a spatiotemporal SVD-based clutter filter was applied to the IQ data to reject background tissue signals and stationary signals. The powers of clutter-filtered data were computed to form a PD image. A noise equalization method (Song et al. 2017a) was applied to the output PD image to improve the image quality. Then, the proposed deconvolution approach was applied to the PD image to achieve the final image using the pre-estimated PSF.
To evaluate spatial resolution, a cross-sectional profile was interpolated with a pixel resolution 10 times higher than the original cross-section profile (MATLAB function “interpl”), and then the FWHM was evaluated by measuring the −6-dB width of the interpolated cross-section profile of a single vessel. Additionally, we used the chicken embryo CAM data set [(axial, lateral): (223,180) pixels] to illustrate the improvement in FWHM statistically. Two hundred twenty-three FWHMs acquired from the cross-sectional profiles of 223 blood vessels (corresponding to 223 pixels in the axial direction) were used to compute the maximum, minimum and mean ± standard deviation of FWHM in this study. Each FWHM was measured from a vessel that had the maximum intensity within a cross-sectional profile.
To investigate the improvement in image quality, the confiast-to-noise ratio (CNR) was used as the performance evaluation. The CNR was defined as
| (8) |
where I1 and I2 are the mean intensities of the selected vessel region of interest (ROI) and background ROI, respectively; and and are the variances of the selected vessel ROI and background ROI, respectively.
RESULTS
Chicken embryo brain
Power Doppler images of chicken embryo brain with and without the proposed deconvolution method are provided in Figure 2a and 2b, respectively. Qualitatively, a sharper PD image and lower background noise level can be achieved with the proposed method. Figure 2c, 2d display a region of interest to illustrate image detail with and without the proposed method. Considering a vessel’s lateral position and axial position as around 2.4 and 5.5 mm, respectively, the thinner vessel is observed after applying the proposed method. The cross-sectional profile of the microvessels is provided in Figure 2e. Without the proposed deconvolution method, the vessel with the highest intensity exhibited an FWHM of 123 μm, whereas the proposed deconvolution method allowed for the imaging of the same vessel with a FWHM of 88 μm. Thus, a nearly 1.4 times improvement in spatial resolution can be achieved with the proposed method. The average computational times used to obtain a PD image with and without the proposed method were around 3.04 and 2.86 s, respectively. The mean and standard deviation of the computational time of the proposed deconvolution method were around 0.18 and 0.04 s, respectively. All computational time results were averaged from 10 repeated measurements. The demonstration MATLAB codes (link) are available online as well.
Fig. 2.
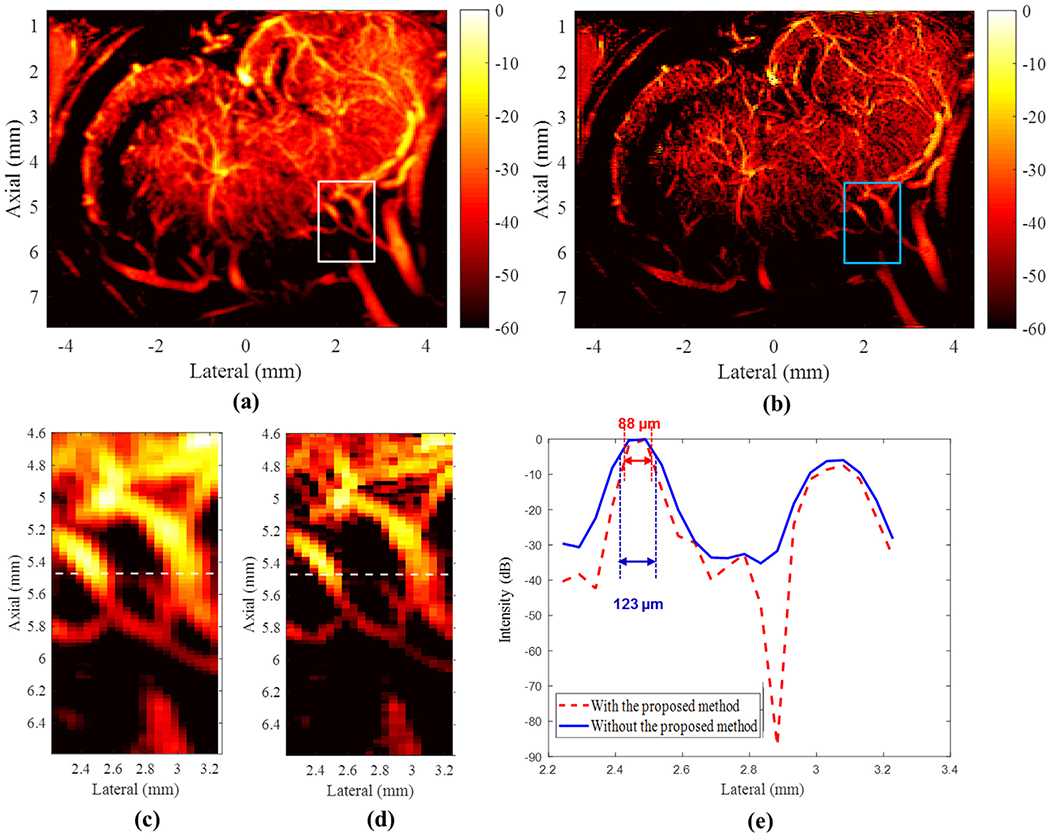
(a) Original power Doppler image. (b) Power Doppler image reconstructed using the proposed deconvolution approach. The dynamic range for both (a) and (b) is 50 dB. (c, d) Regions of interest indicated by the white box in (a) and blue box in (b), respectively. The white lines in (c) and (d) represent the cross-sectional profile at a depth of 5.47 mm. (e) Corresponding full width half-maximums with and without the proposed method, illustrating the improved spatial resolution performance with the proposed approach.
Chicken embryo CAM
Figures 3a and 3b are chicken embryo CAM images with and without the proposed deconvolution method, respectively. The optical microscopy image from the same region of the CAM surface vessel was used as the ground truth, as illustrated in Figure 3c. The zoomed regions of Figure 3a–c indicated by the white dashed boxes are illustrated in Figures 3d–f, respectively). The spatial resolution with and without the proposed method was quantitatively evaluated by plotting a vessel profile along the white dashed line as indicated in Figure 3d, 3e. As illustrated in Figure 3g, the microvessel cross-sectional profile has an FWHM of 132 μm using conventional PD and 83 μm with the proposed deconvolution processing. The microvessel size, measured on the zoomed optical image, was around 67 μm, as illustrated in Figure 3f. This result confirmed the improvement in spatial resolution using the proposed technique. Additionally, 223 FWHMs from 223 axial positions were measured, and the corresponding FWHMs with and without the proposed method are illustrated in Figure 4a. The mean ± standard deviation of FWHM without and with the proposed method was 233.19 ± 85.08 and 172.31 ± 75.11 μm; the maximum FWHM without and with the proposed method was 693.01 and 668.69 μm; and the minimum FWHM without and with the proposed method was 73.92 and 45.74 μm, respectively. In Figure 4b is the boxplot of FWHMs with and without the proposed deconvolution method. The 25th percentile, median and 75th percentile values of all 223 FWHMs were 184.8, 212.52 and 254.1 μm, respectively, without the proposed deconvolution method and 110.8 μm, 138.6 μm, and 196.4 μm, respectively, with the proposed method. A statistical significance was observed for differences between FWHMs with and without the proposed method, using the rank-sum test, p < 0.0001. These results indicate that FWHMs with the proposed method provide better resolution than those without the proposed method. In addition, we compared the performance of the proposed method with Tikhonov regularization, as illustrated in Figure 5. The optical microscopy image was used as the ground truth, as illustrated in Figure 5a. Figure 5b is the CAM image reconstructed by Tikhonov regularization. Because of the ringing artifacts, false blood vessels near large vessels appeared using Tikhonov regularization, as indicated by the white arrows in Figure 5b. On the other hand, the proposed method exhibits fewer ringing artifacts in Figure 5c, and false blood vessels did not appear. The results illustrate that the proposed deconvolution method performs better than Tikhonov regularization.
Fig. 3.
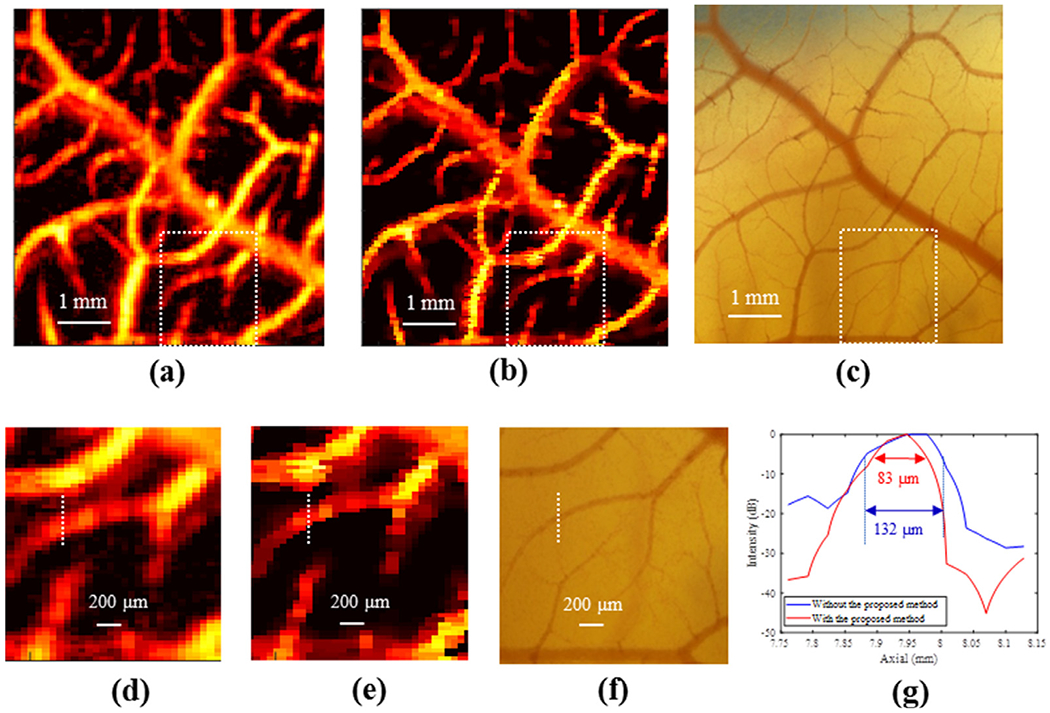
(a) Original power Doppler image of the chorioallantoic membrane (CAM) vasculature. (b) Power Doppler image of the CAM vasculature reconstructed by the proposed deconvolution method. The dynamic range for both (a) and (b) is 70 dB. (c) Microscopic image of the CAM model. (d–f) Regions of interest indicated by the white boxes in (a)–(c). (g) Corresponding cross-sectional profile with measurements of the full width at half-maximum.
Fig. 4.
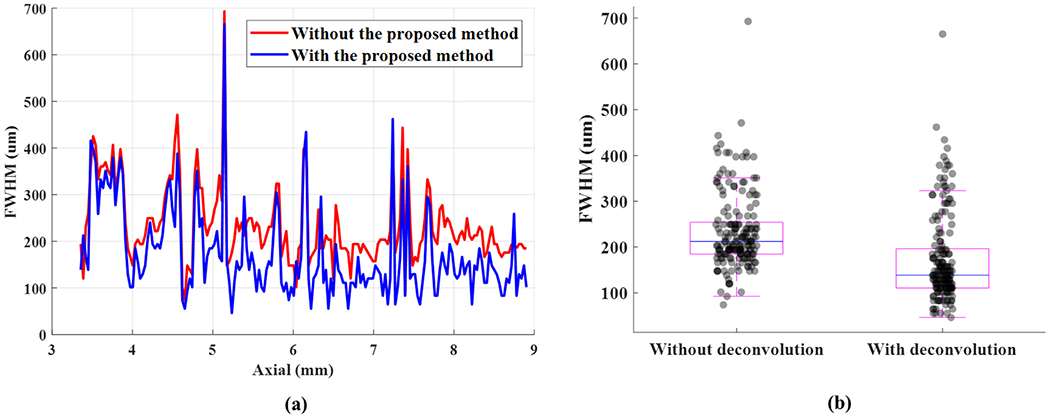
(a) Full width at half-maximum (FWHM) with respect to axial position, where each FWHM was measured from a vessel that has maximum intensity within a cross-sectional vessel’s profile. (b) Boxplot of the distributions of FWHMs with and without the proposed deconvolution method.
Fig. 5.
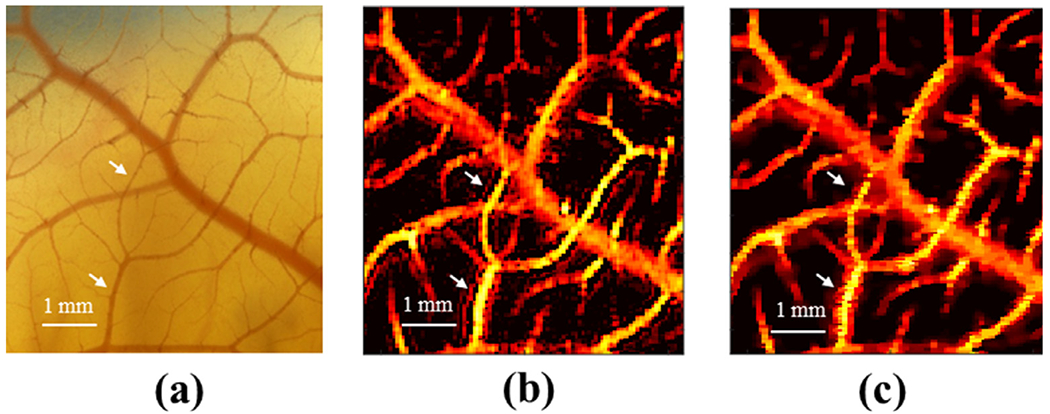
(a) Microscopic image of the chorioallantoic membrane (CAM) model. (b) Power Doppler image of the CAM vasculature reconstructed by Tikhonov regularization. (c) Power Doppler image of the CAM vasculature reconstructed by the proposed method. The dynamic range for all images is set at 70 dB.
Chicken embryo tumor
Chicken embryo tumor images with and without the proposed deconvolution method are provided in Figure 6a, 6b. Qualitatively, a sharper PD image can be obtained with the proposed deconvolution method. The magnified PD images of a tumor xenograft on the chicken embryo are provided in Figure 6c, 6d. The cross-sections of interest indicated by the white dashed lines in Figure 6c, 6d are illustrated in Figure 6e. Two branching microvessels (indicated by green arrows), 154 μm apart, can be distinguished using both methods, but the proposed method provides better separation than conventional PD imaging.
Fig. 6.
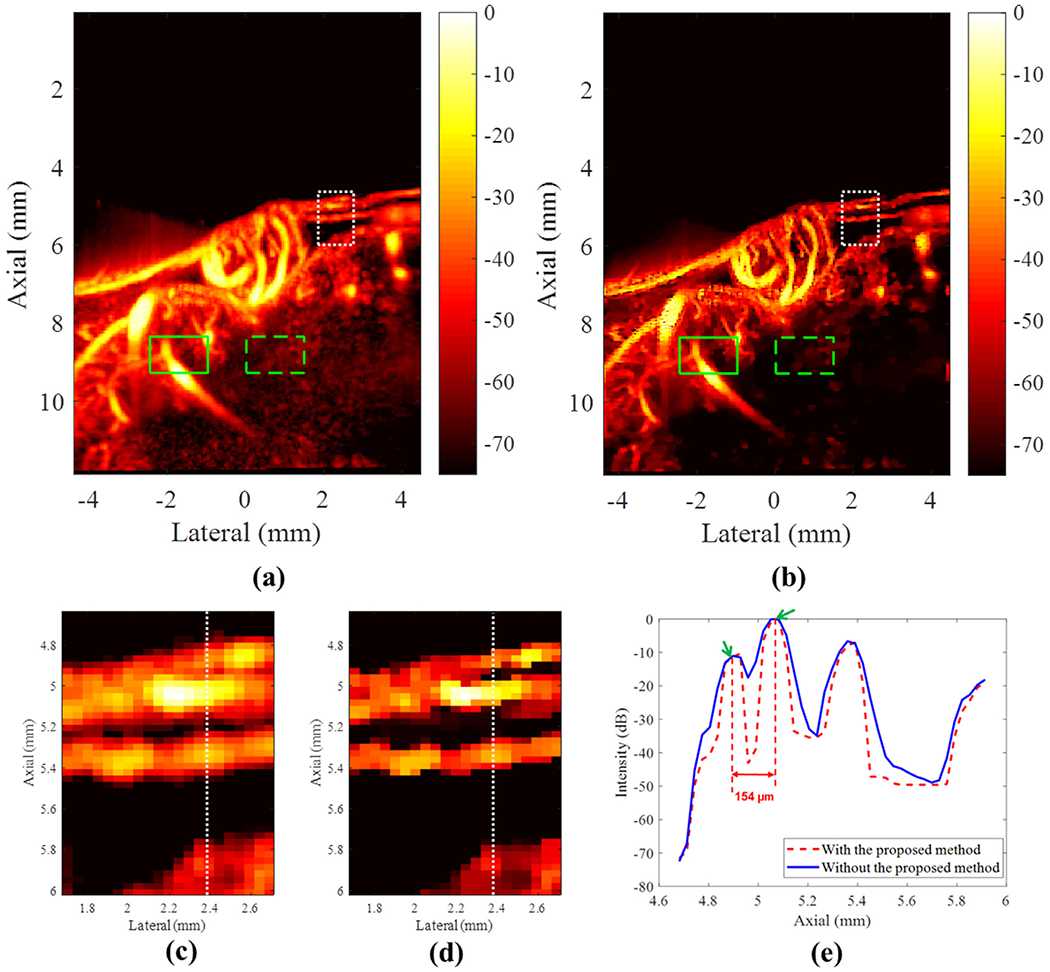
(a) Original power Doppler image of the chicken embryo tumor vasculature. (b) Power Doppler image of the chicken embryo tumor vasculature reconstructed using the proposed approach. The dynamic range for both (a) and (b) is 70 dB. (c, d) Regions of interest indicated by the white boxes in (c) and (d). The white lines represent the cross-sectional profile at a lateral position of 2.39 mm. (e) The corresponding cross-sectional profiles with and without the proposed method indicate two branching vessels, approximately 0.154 mm apart.
In addition, the CNR with and without the proposed method was evaluated as illustrated in the green solid and dashed boxes in Figure 6a, 6b. The green solid boxes were used to compute the mean intensity of the selected vessel ROI, while the green dashed boxes were used to compute the variance of the selected noise ROI. CNR improved from 1.06 to 4.03 dB with use of the proposed method.
The PD images with and without the proposed deconvolution method are provided in Figure 7a, 7b. The dynamic ranges in Figures 7a, 7b were set at 40 dB to provide better visualization of the output PD images. In Figure 7c–e are the corresponding cross-sectional profiles from the three locations indicated by the dashed lines in Figure 7a, 7b. The FWHMs decreased by approximately 0.17, 0.15 and 0.11 mm at the three locations, which illustrates the feasibility of the proposed method at the clinical imaging frequency.
Fig. 7.
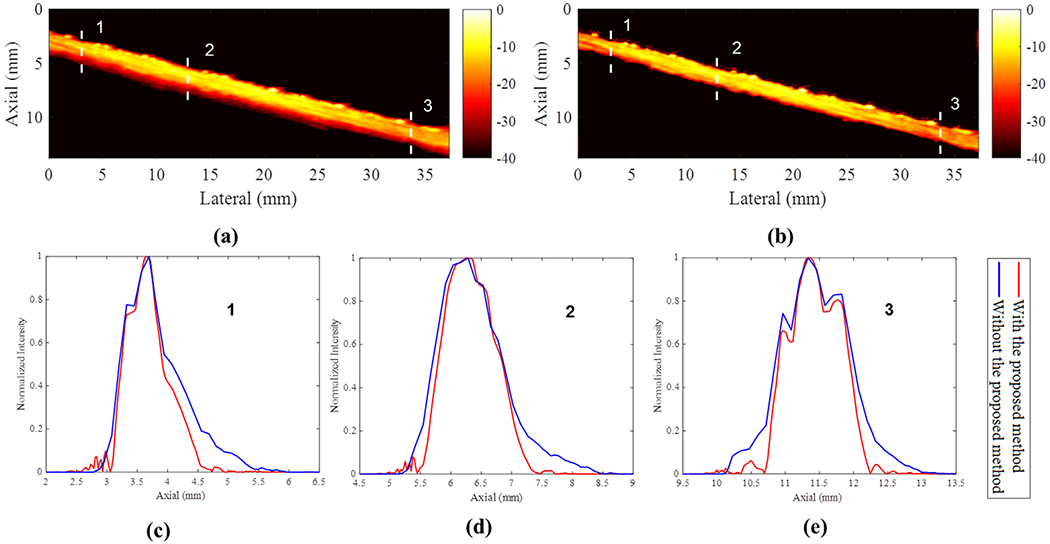
(a) Power Doppler image of the flow phantom. (b) Power Doppler image of the flow phantom reconstructed with the proposed deconvolution approach. (c–e) Cross-sections indicated by dashed lines in (a) and (b). The dynamic range was set as 40 dB.
DISCUSSION
In this study, we found that the spatial resolution of PD images can be improved by deconvolution with the single PSF estimated using experimental MB signals. Because the PSF varies spatially and is system dependent, image quality can be further improved with the spatially variant PSF. To achieve deconvolution with the spatially variant PSF, the PSF estimation and the deconvolution algorithm should be modified. First, for the PSF estimation, one method to estimate the spatially variant PSF is to measure and average MB signals from different locations over multiple frames. Another method to estimate the required PSF is the use of simulation (Shin et al. 2009). The input parameters of the simulation, such as width, height and kerf of each transducer element, radius of the elevational focus, sound speed and system impulse response, should be set to match the desired transducer and ultrasound system. Second, as the spatially variant PSF is modeled, a spatially variant PSF matrix (S) can be used to solve the cost function to improve deconvolution performance, as indicated by
| (9) |
However, as the matrix S is no longer spatially invariant, the fast Fourier transform-based method (Chambolle and Pock 2011) cannot be used to solve this optimization problem iteratively, and thus, the computational complexity of the deconvolution process increases. Therefore, the proposed deconvolution method using a spatially invariant PSF is preferable because of the feasibility of real-time PD imaging.
Several issues should be addressed. The first is the need to identify the appropriate regularization parameter (λ), estimated system PSF and number of iterations. For clinical application, the regularization term and system PSF for different applications should be tuned according to system parameters, such as center frequency and number of pulse cycles. Second, the number of iterations should be tuned to achieve a reasonable result. Twenty iterations were used in this study; however, better results may be achieved by increasing the iterations at the expense of longer computational time. Another limitation of the proposed method is that PD intensity values are altered and no longer represent the power of red blood cell backscattering signals. Therefore, it is not possible to use the deconvolved images from the proposed method to calculate the backscattering-related quantifications such as fractional moving blood volume estimation. Although the computation time of the proposed method was approximately 0.18 s using MATLAB, the processing time can be significantly reduced by using parallel processing with either multicore CPUs or GPUs (Pock et al. 2007) to make the real-time deconvolution feasible.
In the present study, only positive values were of concern after reconstruction of the PD image; thus, a pixel value lower than zero will be removed (set as zero). Instead of discarding negative values, non-negative constraints could be applied to eqn (5) to further improve reconstruction performance in future studies. Moreover, only the finite difference operator D was applied to the regularization kernel in this study. Other kernels, such as wavelet (Khare and Shanker Tiwary 2005) and curvelet (Starck et al. 2002), can be used to adapt the regularization kernel to different applications. The performance of the curvelet transform is promising, as it (Bal et al. 2019) can represent an image at different scales and different angles. Regularization kernels could be investigated to further improve reconstruction performance in future studies. Consequently, non-negative constraint and different regularization kernel can be used to further improve the performance of the proposed method. On the other hand, we evaluated the CNR only to illustrate the improvement in contrast resolution with the proposed method; to further improve the evaluation metric, the generalized CNR (Rodriguez-Molares et al. 2020) can be used in future studies because of its robustness against the dynamic range and its ability to provide a quantitative measurement for contrast.
CONCLUSIONS
In this study, we use a proposed deconvolution method to improve spatial resolution without increasing ultrasound frequency. Chicken embryo brain, CAM and tumor data were used to illustrate the feasibility of the proposed method. Compared with original PD images, the PD images reconstructed by the proposed method provided better spatial resolution, higher CNRs and sharper microvessel imaging. In addition, the proposed deconvolution method revealed fewer ringing artifacts and smoother background noise compared with the Tikhonov regularization method.
Acknowledgments–
This project was supported in part by the National Institutes of Health (NIH) under Award Nos. R01 DK120559, R03 EB027742 and R00 CA214523. The content is solely the responsibility of the authors and does not necessarily represent the official views of the NIH. The authors thank Desiree Lanzino for her assistance in editing the article.
REFERENCES
- Bal A, Banerjee M, Sharma P, Maitra M. An efficient wavelet and curvelet-based PET image denoising technique. Med Biol Eng Comput 2019;57:2567–2598. [DOI] [PubMed] [Google Scholar]
- Chambolle A, Pock T. A first-order primal-dual algorithm for convex problems with applications to imaging. J Math Imaging Vis 2011;40:120–145. [Google Scholar]
- Demene C, Deffieux T, Pernot M, Osmanski BF, Biran V, Gennisson JL, Sieu LA, Bergel A, Franqui S, Correas JM, Cohen I, Baud O, Tanter M. Spatiotemporal clutter filtering of ultrafast ultrasound data highly increases Doppler and fultrasound sensitivity. IEEE Trans Med Imaging 2015;34:2271–2285. [DOI] [PubMed] [Google Scholar]
- Dey N, Blanc-Feraud L, Zimmer C, Roux P, Kam Z, Olivo-Marin JC, Zerubia J. Richardson–Lucy algorithm with total variation regularization for 3 D confocal microscope deconvolution. Microsc Res Tech 2006;69:260–266. [DOI] [PubMed] [Google Scholar]
- Huang C, Lowerison MR, Lucien F, Gong P, Wang D, Song P, Chen S. Noninvasive contrast-free 3D evaluation of tumor angiogenesis with ultrasensitive ultrasound microvessel imaging. Sci Rep 2019;9:4907. [DOI] [PMC free article] [PubMed] [Google Scholar]
- Huang C, Song P, Gong P, Trzasko JD, Manduca A, Chen S. Debiasing-based noise suppression for ultrafast ultrasound microvessel imaging. IEEE Trans Ultrason Ferroelectr Freq Control 2019;66:1281–12391. [DOI] [PMC free article] [PubMed] [Google Scholar]
- Jensen JA, Mathorne J, Gravesen T, Stage B. Deconvolution of in-vivo ultrasound B-mode images. Ultrason Imaging 1993;15:122–133. [DOI] [PubMed] [Google Scholar]
- Khare A, Shanker Tiwary U. A new method for deblurring and denoising of medical images using complex wavelet transform. Conf Proc IEEE Eng Med Biol Soc 2005;2:1897–1900. [DOI] [PubMed] [Google Scholar]
- Lok UW, Song P, Trzasko JD, Borisch EA, Daigle R, Chen S. Parallel implementation of randomized singular value decomposition and randomized spatial downsampling for real time ultrafast microvessel imaging on a multi-core CPUs architecture. 2018 IEEE International Ultrasonics Symposium (IUS). Kobe, Japan 1–4. doi: 10.1109/ULTSYM.2018.8579678. [DOI] [Google Scholar]
- Mauldin FW Jr, Lin D, Hossack JA. The singular value filter: A general filter design strategy for PCA-based signal separation in medical ultrasound imaging. IEEE Trans Med Imaging 2011;30:1951–1964. [DOI] [PMC free article] [PubMed] [Google Scholar]
- Pock T, Grabner M, Bischof H. Real-time computation of variational methods on graphics hardware. In: Grabner M, Grabner H, (eds). Computer Vision Winter Workshop 2007, St. Lambrecht, Austria, February 6–8. Berlin/Heidelberg: Springer; 2007. [Google Scholar]
- Rangarajan R, Krishnamurthy CV, Balasubramaniam K. Ultrasonic imaging using a computed point spread function. IEEE Trans Ultrason Ferroelectr Freq Control 2008;55:451–464. [DOI] [PubMed] [Google Scholar]
- Rodriguez-Molares A, Rindal OMH, D’Hooge J, Masoy SE, Austeng A, Lediju Bell MA, Torp H. The generalized contrast-to-noise ratio: A formal definition for lesion detectability. IEEE Trans Ultrason Ferroelectr Freq Control 2020;67:745–759. [DOI] [PMC free article] [PubMed] [Google Scholar]
- Shin HC, Prager R, Ng J, Gomersall H, Kingsbury N, Treece G, Gee A. Sensitivity to point-spread function parameters in medical ultrasound image deconvolution. Ultrasonics 2009;49:344–357. [DOI] [PubMed] [Google Scholar]
- Song P, Manduca A, Trzasko JD, Chen S. Noise equalization for ultrafast plane wave microvessel imaging. IEEE Trans Ultrason Ferroelectr Freq Control 2017;64:1776–1781. [DOI] [PMC free article] [PubMed] [Google Scholar]
- Song P, Manduca A, Trzasko JD, Chen S. Ultrasound small vessel imaging with block-wise adaptive local clutter filtering. IEEE Trans Med Imaging 2017;36:251–262. [DOI] [PubMed] [Google Scholar]
- Song P, Trzasko JD, Manduca A, Qiang B, Kadirvel R, Kallmes DF, Chen S. Accelerated singular value-based ultrasound blood flow clutter filtering with randomized singular value decomposition and randomized spatial downsampling. IEEE Trans Ultrason Ferroelectr Freq Control 2017;64:706–716. [DOI] [PubMed] [Google Scholar]
- Starck JL, Candes EJ, Donoho DL. The curvelet transform for image denoising. IEEE Trans Image Process 2002;11:670–684. [DOI] [PubMed] [Google Scholar]
- Yang F, Huang Y, Luo Y, Li L, Li H. Robust image restoration for motion blur of image sensors. Sensors (Basel) 2016;16:845. [DOI] [PMC free article] [PubMed] [Google Scholar]


