
Fig. 3.
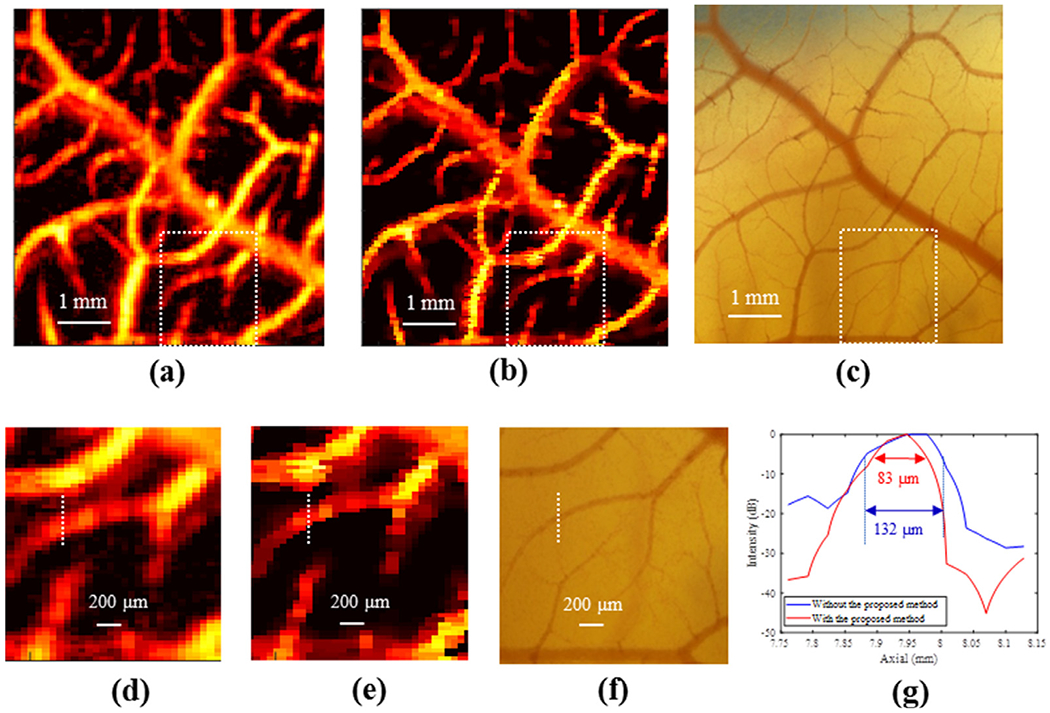
(a) Original power Doppler image of the chorioallantoic membrane (CAM) vasculature. (b) Power Doppler image of the CAM vasculature reconstructed by the proposed deconvolution method. The dynamic range for both (a) and (b) is 70 dB. (c) Microscopic image of the CAM model. (d–f) Regions of interest indicated by the white boxes in (a)–(c). (g) Corresponding cross-sectional profile with measurements of the full width at half-maximum.