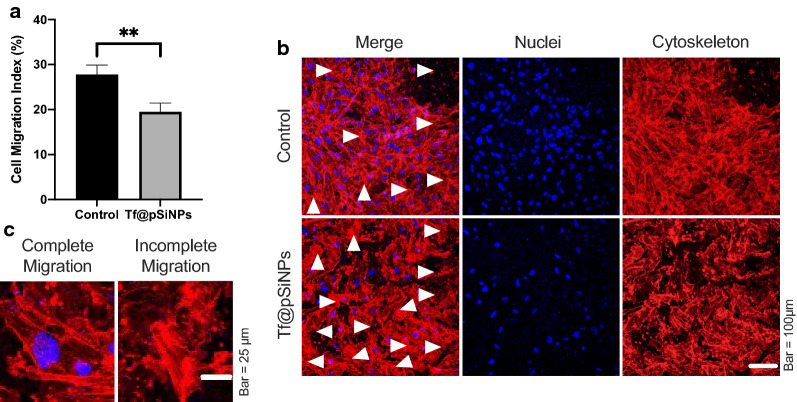
Fig. 3.
Tf@pSiNPs significantly reduced WK1 cell migration. a Quantification of cell migration at 48 h (data presented as mean ± 1 standard deviation, ** indicates p < 0.01, Student’s t-test, n = 3). b Image of cells on the underside of the transwell membrane; white arrows mark areas where cells have not completely cleared the perforation. c Magnified image of cells on the underside of the transwell membrane, showing examples of cells that completed migration across the perforations, and those that did not. Phalloidin (red) and Hoechst 33,342 (blue) staining allowed visualisation of the cytoskeleton and nuclei, respectively. Tf@pSiNPs transferrin-functionalised porous silicon nanoparticles

