Fig. 4.
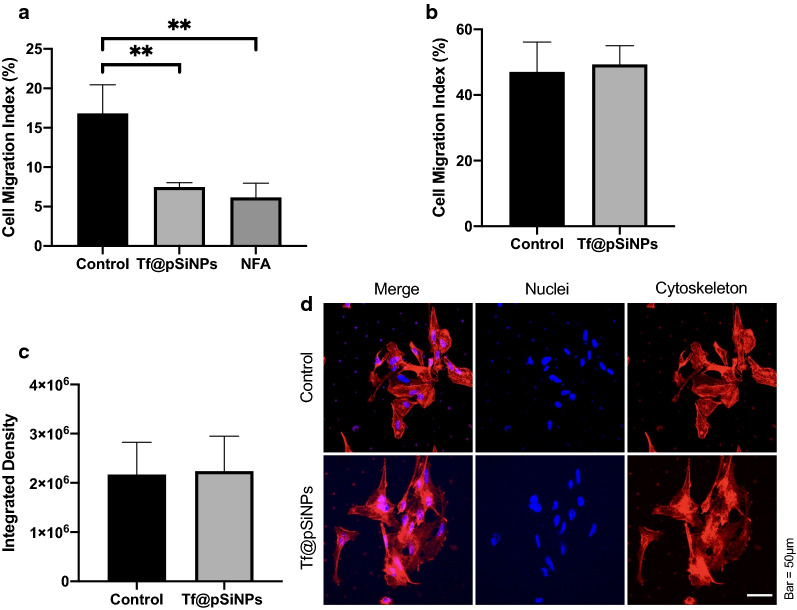
WK1 cell migration across 3 μm perforations over 48 h with different treatments. a Quantification of cell migration, across 3 μm perforations, following Tf@pSiNPs- or NFA-treatment (data presented as mean ± 1 SD, ** indicates p < 0.01, one-way analysis of variance, n = 3). b Quantification of WK1 cell migration across 8 μm perforations following treatment with Tf@pSiNPs (data presented as mean ± 1 SD, n = 3); no significant difference in migration was observed (Student’s t-test). c Quantification of the intensity of cytoskeletal staining, following treatment with Tf@pSiNPs (data presented as mean ± 1 SD, n = 3) no significant difference was observed (Student’s t-test). d Representative image of the cytoskeletal structure of cells under nanoparticle treatment. Phalloidin (red) and Hoechst 33,342 (blue) staining allowed visualisation of the cytoskeleton and nuclei, respectively. Tf@pSiNPs transferrin-functionalised porous silicon nanoparticles, NFA niflumic acid, SD standard deviation

