Fig. 5.
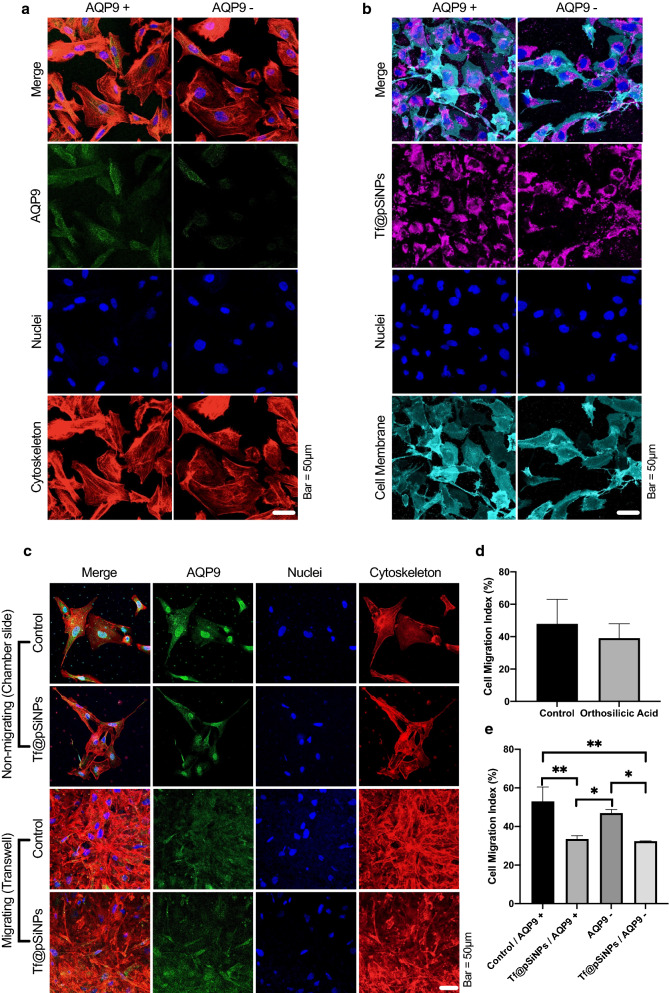
AQP9 was not involved in Tf@pSiNPs’ mode of action. a AQP9 silencing confirmation following transfection. b Image of cells in a chamber slide to evaluate the uptake of Tf@pSiNPs after AQP9 silencing. c Image of cells in a chamber slide or the underside of a transwell, to identify the expression of AQP9 in non-migrating and migrating cells, respectively, with and without Tf@pSiNPs. d Quantification of cell migration following orthosilicic acid-treatment (data presented as mean ± 1 SD, n = 3) no significant difference was observed (Student’s t-test). e Quantification of cell migration at 48 h (data presented as mean ± 1 SD, * indicates p < 0.05, ** indicates p < 0.01, one-way analysis of variance, n = 3). Phalloidin (red), Alexa 488 (green), Cyanine5 (magenta), Vybrant (cyan) and Hoechst 33,342 (blue) staining allowed visualisation of the cytoskeleton, AQP9, Tf@pSiNPs, cell membrane and nuclei, respectively. Tf@pSiNPs transferrin-functionalised porous silicon nanoparticle. AQP9 aquaporin9, siRNA small interfering ribonucleic acid

