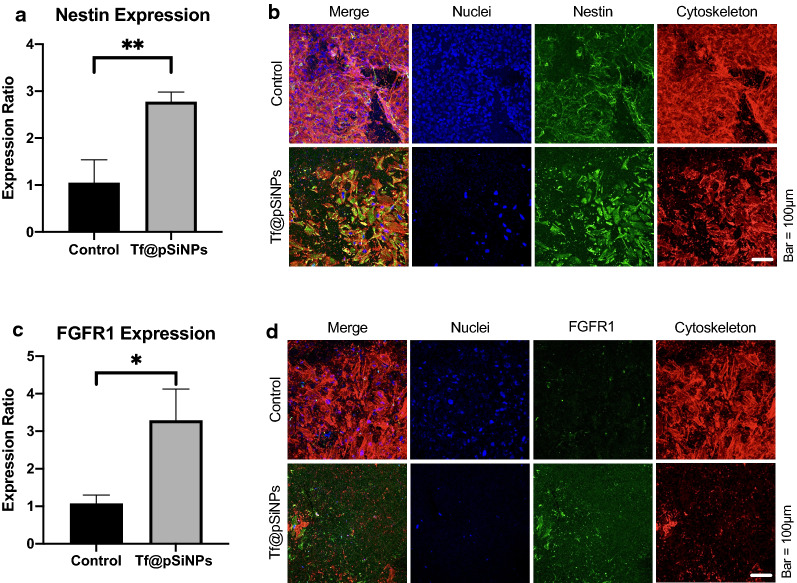
Fig. 6.
A greater proportion of WK1 cells migrating after treatment with Tf@pSiNPs express Nestin/ FGFR1. a Ratio of Nestin expression on the underside of the membrane to the top side (data presented as mean ± 1 SD, ** indicates p < 0.01, Student’s t-test, n = 3). b Image of cells at the underside of the transwell membrane, showing cells that have successfully migrated, and nestin-expression in those cells. Phalloidin (red), Alexa 488 (green) and Hoechst 33,342 (blue) staining allowed visualisation of the cytoskeleton, nestin and nuclei, respectively. c Ratio of FGFR1-expression on the underside of the membrane to the top side (data presented as mean ± 1 SD, * indicates p < 0.05, Student’s t-test, n = 3). D Image of cells at the underside of the transwell membrane, showing cells that have successfully migrated, and FGFR1 expression on those cells. Phalloidin (red), Alexa 488 (green) and Hoechst 33,342 (blue) staining allowed visualisation of the cytoskeleton, FGFR1 and nuclei, respectively. Tf@pSiNPs transferrin-functionalised porous silicon nanoparticles, FGFR1 fibroblast growth factor receptor 1, SD standard deviation

