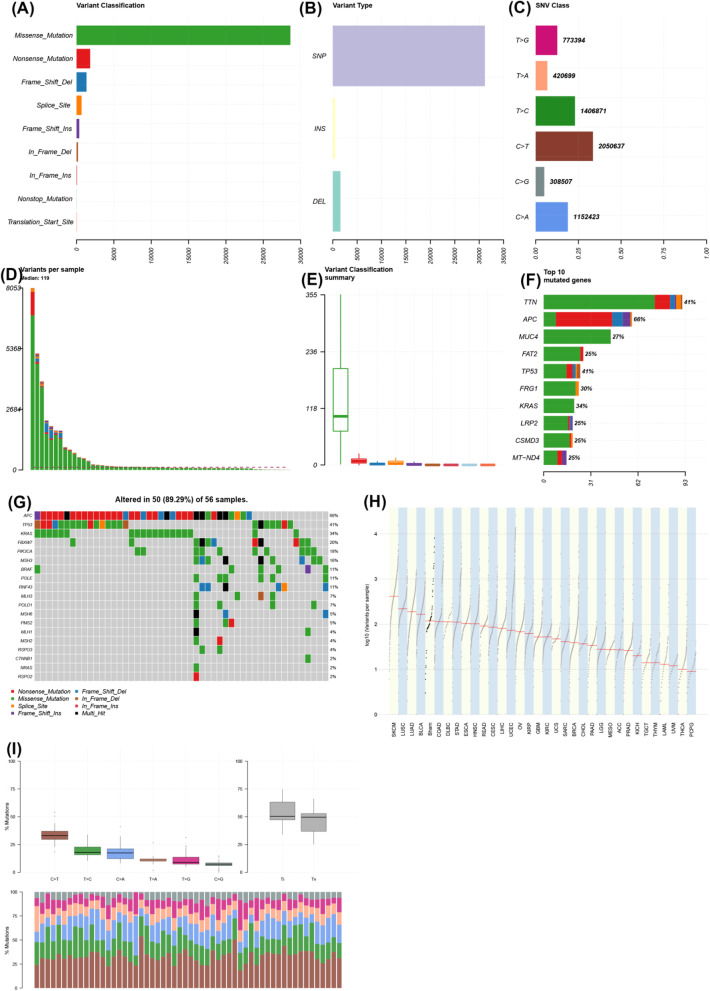
Fig. 1.
Integrated plot of the characteristics of the whole-genome sequencing dataset of colorectal cancer. a Variant classification by type (y-axis), frequency of variant (x-axis). b Variant type (y-axis). SNP, single nucleotide polymorphism; INS, insertion; DEL, deletion; frequency (x-axis). c Single nucleotide variant (SNV) class plot—y-axis demonstrates nucleotide changes; the x-axis demonstrates the proportions of variants in the cohort; numbers on the end of bars demonstrate the total numbers of each variant. d Bar chart showing variants per sample—variants (y-axis); samples on the x-axis. e Variant classification summary showing the range of variants per sample (y-axis); the x-axis shows missense (green), nonsense (red), frameshift deletion (blue), splice site (yellow), frameshift insertion (purple), in-frame deletion (brown), in-frame insertion (dark red), non-stop mutation (light blue) and transcription start site mutation (orange). f Top ten mutated genes by frequency—genes on the y-axis, numbers of mutations on the x-axis; colours are the same as in e. g Oncoprint of colorectal driver genes (left y-axis) by sample (x-axis) with the variant type shown in the key. Percentages across the whole cohort are seen in percentages down the right y-axis. h TCGA style log [10] variants per sample plot (y-axis) with TCGA cohorts (x-axis); Bham, Birmingham cohort (fifth from left). I Mutational type plot: top left panel—% mutation changes in the cohort; top right panel—% transition vs. transversion mutations across the cohort; bottom panel—bar chart showing the proportion of mutations with the percentage on the y-axis and the type of mutations shown by different coloured bars

