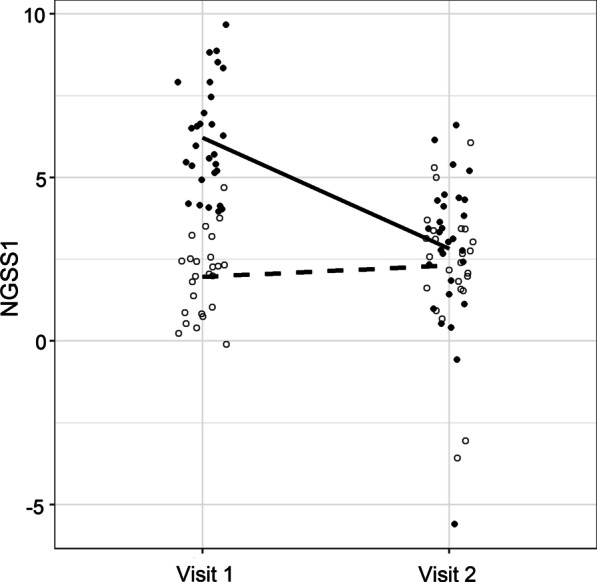
Fig. 2.

Paired comparisons between visit 1 and visit 2 using NGSS1 (panel a) and NGSS2 (panel b). A total of n = 54 subjects with samples in both visits were used. Solid dots represent severe subjects and empty dots represent mild subjects. The solid line represents the mean trend of severe subjects and the broken line represents the mean trend for mild subjects. a At visit 1, there was a significant difference in mean NGSS1 between the severe (n = 29) and mild (n = 25) groups (6.22 vs. 1.96, p < 0.001). Mean NGSS1 of the mild group was virtually unchanged between two visits (1.96 vs. 2.31, p = 0.45). In comparison, mean NGSS1 of the severe group declined significantly at visit 2 (6.22 vs. 2.82, p < .001). b In contrast to NGSS1, the differences in NGSS2 was virtually unchanged between the two visits, due to the fact that NGSS2 were built with stable genes
