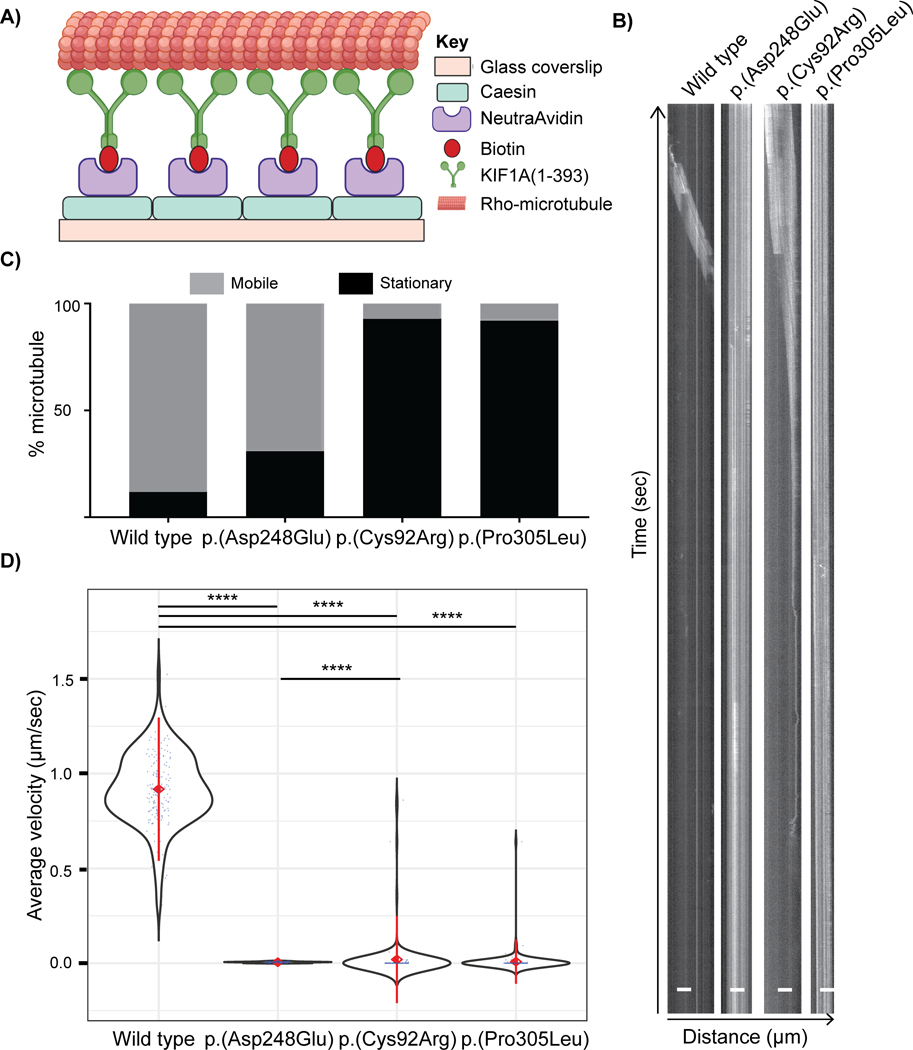
Figure 3: in vitro microtubule gliding driven by wild-type and variant KIF1A motors.
A) Schematic of the microtubule gliding assay in a flow chamber modified from (Yue et al., 2018). The biotinylated KIF1A(1–393)-LZ-mNG-AviTag motor proteins expressed in COS-7 cells were immobilized on a NeutrAvidin-coated glass coverslip. The motility mix containing rhodamine-labelled microtubules, ATP, and oxygen-scavenging system was then added into the flow chamber. Time lapse images were captured using the TIRF microscope. B) Representative kymographs (distance versus time graphs) for rhodamine-labeled microtubule movement over “lawns” of wild-type or variant KIF1A proteins. Time (seconds) is on y-axis and distance travelled (μm) is on x-axis. The angled line represents movement and straight line signifies stationary microtubules. C) Quantification of the percentage of microtubules that were stationary versus motile. D) Violin plot representing average velocity (μm/sec) of microtubules moved by KIF1A(1–393) proteins. Black = violin plot, blue = each data point, red diamond with center = mean, red line = +/− standard deviation. The average velocity for every variant KIF1A motor domain protein was significantly reduced compared to the wild type protein. Data are analyzed from three independent experiments (n=50 microtubules each) and is plotted as mean ± standard deviation. **** represents p<0.0001, Mann-Whitney test.

