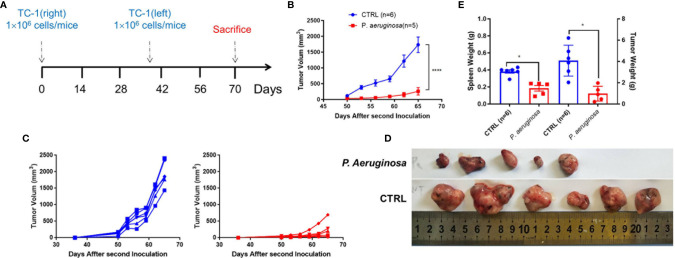
Figure 2.
Development of long-lasting antitumor immunity against TC-1 tumor cells following P. aeruginosa co-injection. (A) Schematic diagram of the procedures for tumor rechallenge experiment. Tumor-free mice were rechallenged with 1 × 10⁶ TC-1 tumor cells again at day 40 on the other side of the primary tumor. (B) Rechallenged tumor growth curve shown as average tumor volumes and standard error of the mean per group (n=5–6). Statistical analysis was performed with two-way ANOVA after Bonferroni correction. (C) Rechallenged tumor growth curve of individual mice are shown for control (n=6) and P. aeruginosa (n=5) co-injected groups. Numbers in the panel demonstrated tumor size and the number of mice are still alive at day 40. This experiment was repeated twice. (D) Representative photographs of rechallenged tumor tissues harvested from each group. (E) Tumor and spleen weight of tumor-bearing mice at the end of the experiment. Data are means ± SEM. Paired Student’s t-test was performed for spleen and tumor weight comparisons and two-way ANOVA for tumor growth curve comparisons. * indicate P-values ≤ 0.05 was considered significant, **** indicate P-values ≤ 0.0001, and ns indicates non-significance.

