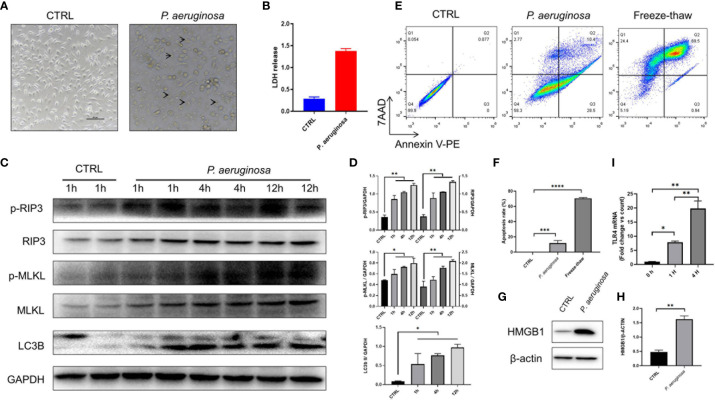
Figure 3.
P. aeruginosa incubation triggered PANoptosis in TC-1 tumor cells.1 × 106 tumor cells were infected with 10 MOI P. aeruginosa for 1 h, 4 h, and 12 h, cell culture supernatants were gently removed and tumor cells were photographed and harvested for immunoassay. (A) Representative photographs of tumor cells treated with or without P. aeruginosa. After incubation, tumor cells were swollen and lysed under the microscope. Arrow represented dying cells. (B) Histogram analysis of lactate dehydrogenase (LDH) release. LDH releasements are represented for tumor cell death in vitro. (C) Western blots of RIP3/pRIP3/MLKL/pMLKL and LC3B in TC-1 cells treated with P. aeruginosa. The WB bands intensity was quantified by image J software. (D) Histogram analysis of the ratio of pRIP3/GAPDH, pMLKL/GAPDH, RIP3/GAPDH, MLKL/GAPDH, LC3B II/GAPDH. (E) Represent FCM images of 7AAD-Annexin V-PE assay. Freeze-thawed TC-1 cells were performed as positive control. (F) The results of cell apoptosis assay. (G) Western blots of HMGB1. (H) Histogram analysis of HMGB1 expression. (I) Histogram analysis of TLR4 expression by RT-PCR in a time-dependent manner. Data are means ± SEM. Paired Student’s t-test was performed for two group comparisons and one-way ANOVA for three groups. * indicate P-values ≤ 0.05 was considered significant, ** indicate P-values ≤ 0.01, *** indicate P-values ≤ 0.001, **** indicate P-values ≤ 0.0001, and ns indicates non-significance.

