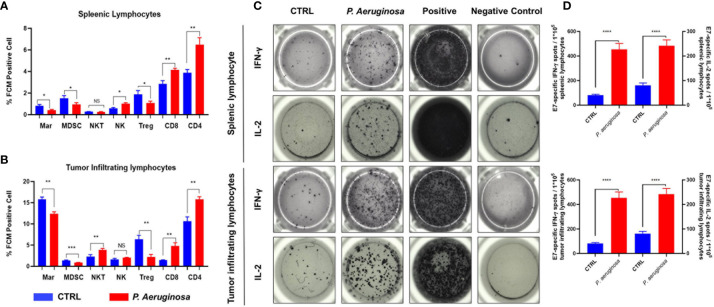
Figure 5.
P. aeruginosa mediated anti-tumor response remodeled systematic and tumor microenvironment immune cell profiles and promoted lymphocytes activation. Histogram analysis of immune cell profiles in (A) splenic lymphocytes and (B) tumor infiltrating lymphocytes by FCM. CD3+CD4+ staining cells were identified as CD4 T cells; CD3+CD8+ staining cells were identified as CD8 T cells; CD4+CD25+ Foxp3+ staining cells were identified as Treg cells; CD3-NK1.1+ staining cells were identified as NK cells; CD3+NK1.1+ staining cells were identified as NK T cells; CD11b+Gr-1+ staining cells were identified as MDSC cells; CD11b+F4/80+ staining cells were identified as macrophages cells; (C) representative images of ELISPOT assay. Indicated 1 × 10⁵ splenic lymphocytes and tumor infiltrating lymphocytes were stimulated with 2 ug/ml E7 specific peptides. Spots were represented as activated lymphocytes, PMA was performed as positive control. (D) Quantitative analysis of antigen specific IFN-γ- and IL-2-expressing lymphocytes detected by ELISPOT. Data are means ± SEM. Paired Student’s t-test was performed for comparisons. * indicate P-values ≤ 0.05 was considered significant, ** indicate P-values ≤ 0.01, *** indicate P-values ≤ 0.001, **** indicate P-values ≤ 0.0001, and ns indicates non-significance.

