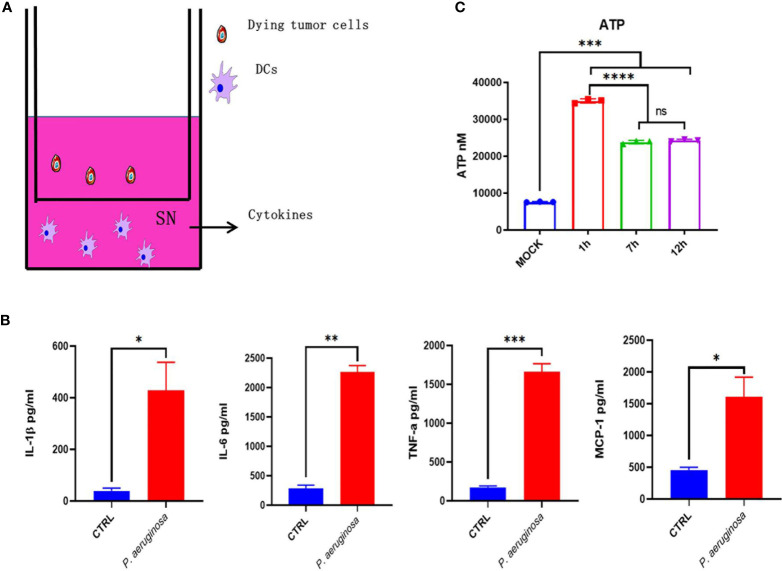
Figure 6.
Dying tumor cells trigger DC maturation. (A) Schematic diagram of incubation of DC2.4 with dying tumor cells. (B) The concentration of cytokines with IL-1β, IL-6, TNF-α, and MCP-1 in DC supernatant after treatment. (C) Histogram analysis of ATP releasement. One-way ANOVA and paired Student’s t-test was performed for comparisons. * indicate P-values ≤ 0.05 was considered significant, ** indicate P-values ≤ 0.01, and *** indicate P-values ≤ 0.001, **** indicate P-value ≤ 0.0001.

