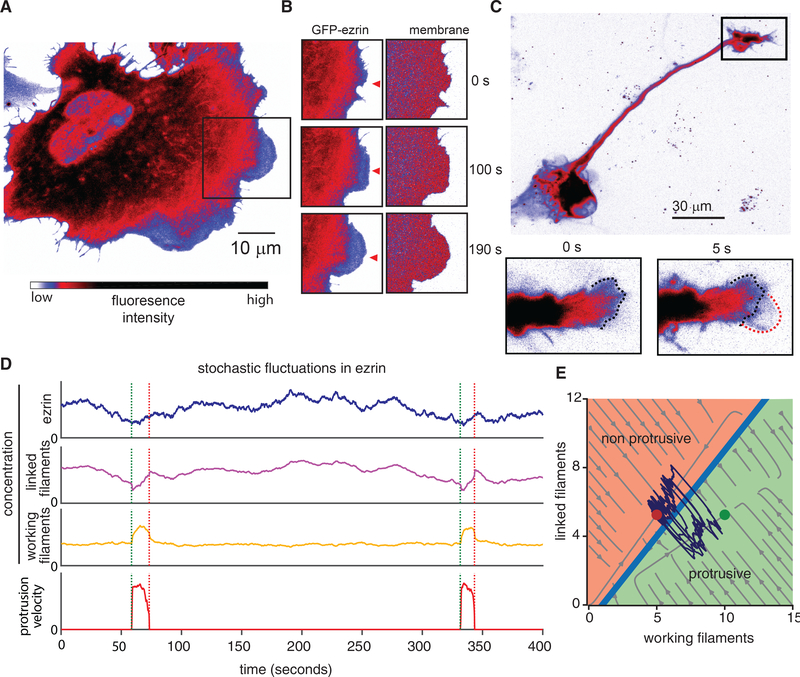
Figure 2. Ezrin Depletion Initiates Protrusion.
(A) Spinning disk confocal microscope image showing GFP-ezrin in a U2OS cell exhibiting actin-driven protrusion in a lamellipodium in the boxed area. Image intensity scale applies to (A–D).
(B) Time-lapse image sequence of GFP-ezrin and tdTomato-membrane marker in the boxed area indicated in (A).
(C) Confocal microscope image showing GFP-ezrin during lamellipodial protrusion in the growth cone of a primary rat cortical neuron.
(D) Simulation of the model, including stochastic fluctuations in local ezrin concentration, resulting in repeated stochastic protrusion events.
(E) Phase diagram showing the relationship between working filaments and linked filaments in the computational model. Circles indicate fixed points bifurcated by a separatrix, with red indicating the non-protrusive region of the phase space and the green indicating the protrusive region. Light gray streamlines show deterministic model solutions, and the dark purple lines show an example simulation trajectory that crosses the separatrix multiple times, indicating repeated protrusions.

