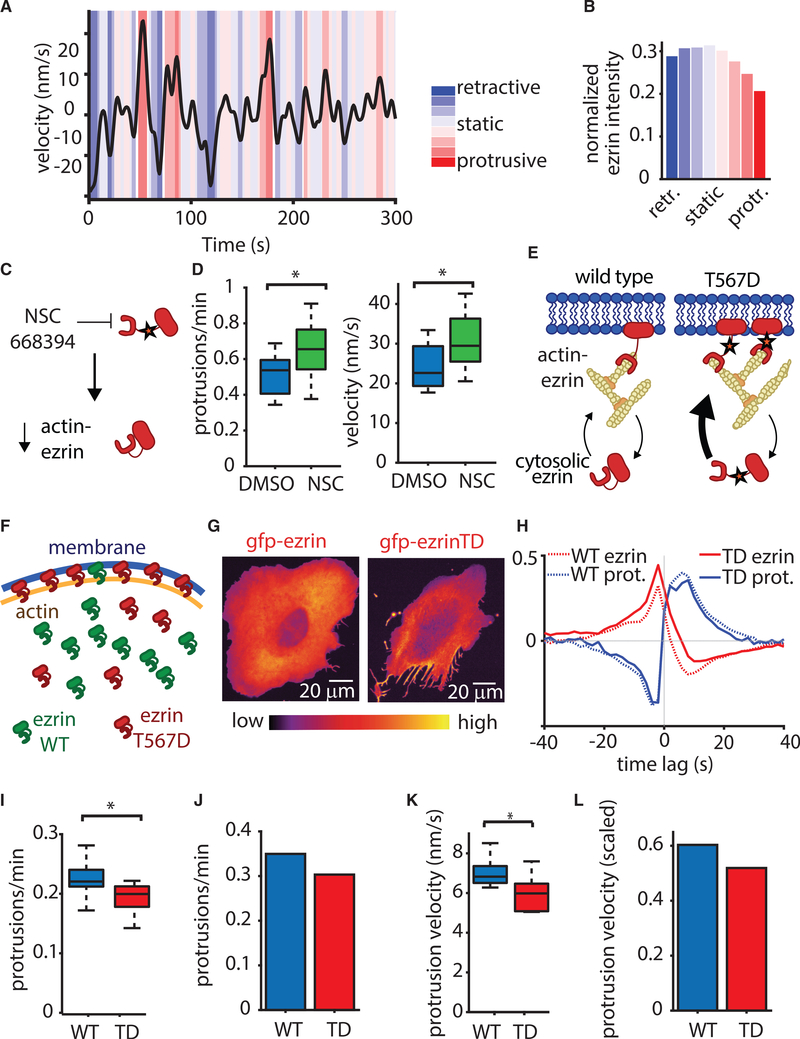
Figure 5. Ezrin’s Actin-Membrane Linking Function Regulates Protrusion.
(A) Hidden Markov modeling is used to classify protrusion states in a time series.
(B) Normalized ezrin intensity during each of the eight HMM states defined in (A). Data include 1,710 velocity time series from n = 12 cells expressing WT GFP-ezrin.
(C) The ezrin inhibitor NSC668394 affects ezrin by inhibiting its phosphorylation, resulting in less actin-bound ezrin.
(D) Protrusion frequency and velocity during actin-driven protrusion in MV3 melanoma cells adhering to fibronectin-coated glass coverslips. p(frequency) = 0.0225, p(velocity) = 0.041 via two-sample t tests, n = 18 cells (NSC) and n = 10 cells (DMSO). Error bars represent 95% confidence intervals.
(E) Mutation of ezrin’s threonine 567 to aspartic acid (TD) increases the affinity of ezrin for actin, resulting in an enrichment of high-affinity ezrin linking actin to the membrane.
(F) Schematic depicting the functional effect of actin affinity of wild type and T567D ezrin on actin-membrane attachment.
(G) Spinning disk confocal microscope images showing morphological differences in typical U2OS cells resulting from overexpression of ezrin T567D.
(H) Normalized edge velocity and GFP-ezrin localization, aligned to protrusion onset imaged in 12 WT and 9-TD U2OS cells generating 27,229 and 25,329 protrusion events, respectively.
(I) Protrusion frequency in cells expressing either WT ezrin or TD ezrin, p = 0.039 via two-sample t test; n = 12 cells (WT) and n = 6 cells (TD). Error bars represent 95% confidence intervals.
(J) Simulations of the actin release model predicting the effect of TD expression on protrusion initiation frequency.
(K) Protrusion velocity in cells expressing either WT ezrin or TD ezrin, p = 0.027 via two-sample t test; n = 12 cells (WT) and n = 6 cells (TD). Error bars represent 95% confidence intervals.
(L) Simulations of the actin release model showing the effect of TD expression on protrusion velocity. In (I) and (K), box plots show the collective measurements for each cell; the central line is the median, the edges of the box are the 25th and 75th percentiles, and the whiskers extend to the most extreme data points.

