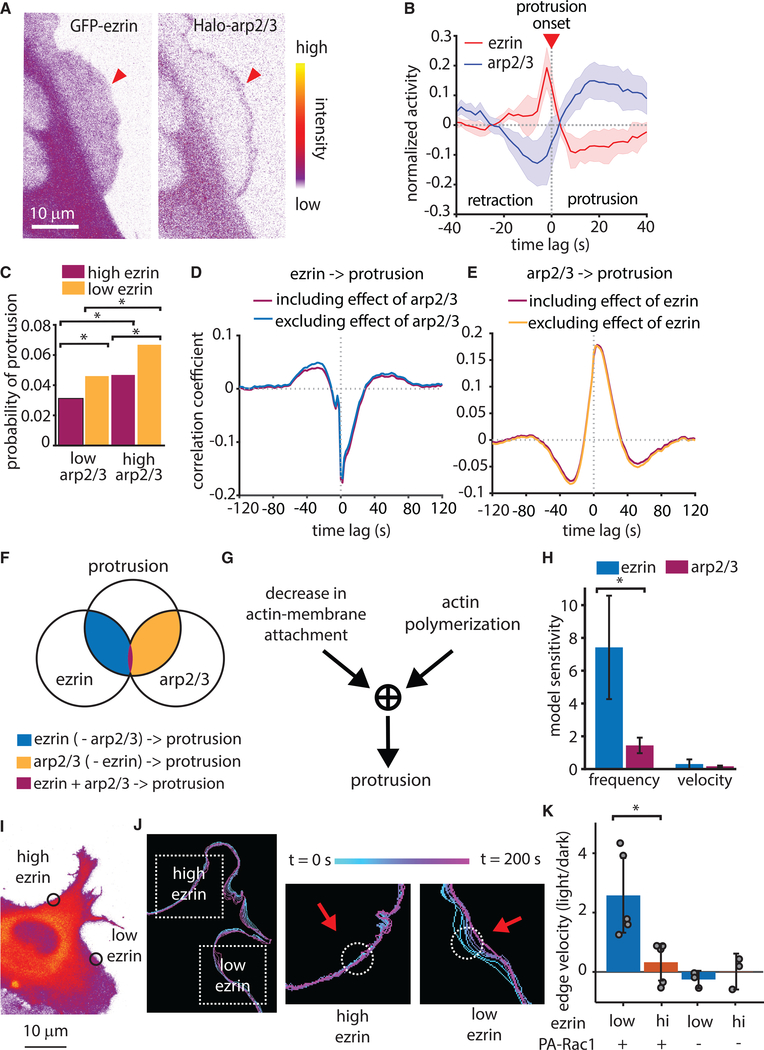
Figure 6. Actin Polymerization and Ezrin Localization Cooperatively Drive Protrusion.
(A) Representative spinning disk confocal microscopy images of a U2OS cell expressing both GFP-ezrin and a HaloTag-Arp2/3.
(B) The normalized activity of GFP-Ezrin and HaloTag-Arp2/3, aligned to protrusion onset (t = 0). Data include 39,686 protrusion events form n = 5 U2OS cells. Shaded areas represent 95% confidence intervals.
(C) Probability of protrusion in sampling windows categorized by HMM of GFP-ezrin and HaloTag-Arp2/3 intensity. p < 0.01 for all comparisons via two-sample t test comparing probability per cell, n = 5 cells.
(D and E) Comparison of full cross-correlation and partial cross-correlation of GFP-ezrin intensity to protrusion (D) and HaloTag-Arp2/3 intensity to protrusion (E). Data include 39,686 multivariate time series from n = 5 cells.
(F) Schematic illustrating the overlap between the effects of ezrin and Arp2/3 on the protrusion.
(G) Diagram depicting a hypothetical AND gate whereby both actin polymerization and reduction in actin-membrane attachment are required for protrusion.
(H) Mean sensitivity of model simulation results for protrusion frequency and velocity calculated from simulations using 10 different parameter values. Error bars show 95% confidence intervals.
(I) Spinning disk confocal microscope image of a U2OS cell depicting regions of high and low ezrin concentration, within which photoactivation of Rac1 was performed.
(J) Outlines of the cell edge at different time points either before or during photoactivation. Dashed boxes indicate area of zoom for high and low ezrin regions, circles show areas of photoactivation, and the colorbar shows time information.
(K) Local edge velocity in either low or high ezrin regions, shown as the velocity in the light state divided by that in the dark state. p = 0.0136 via two-tailed t test n = 5 for each ezrin low and ezrin high conditions. Error bars represent 95% confidence intervals. Local ezrin concentration and presence of the PA-Rac1 construct are as indicated below the x axis.

