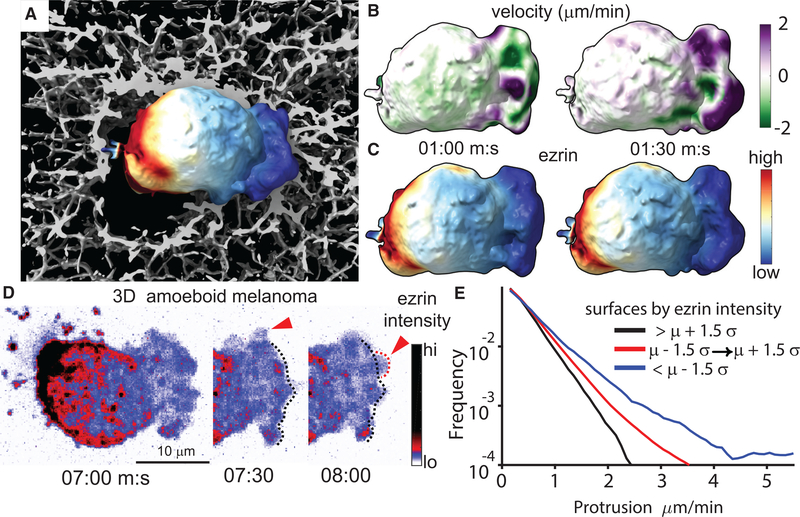
Figure 7. Actin-Membrane Release Creates Pressure-Driven Protrusion.
(A) Surface rendering of melanoma cell in 3D collagen with the intensity of GFP-ezrin mapped to the cell surface, generated from light-sheet microscope images.
(B and C) Time-lapse data of the cell shown in (A) were used to quantify surface motion (B) and ezrin intensity (C) as a function of time.
(D) Maximum intensity projection (MIP) of light-sheet microscope images showing GFP-ezrin intensity during new bleb formation. Red arrows indicate newly formed blebs.
(E) Quantification of surface motion on blebs as a function of ezrin intensity measured in 21 cells. Data are displayed as the relative frequency in groups separated by ezrin intensity either above, below, or within ±1.5 times the standard deviation of all measurements.

