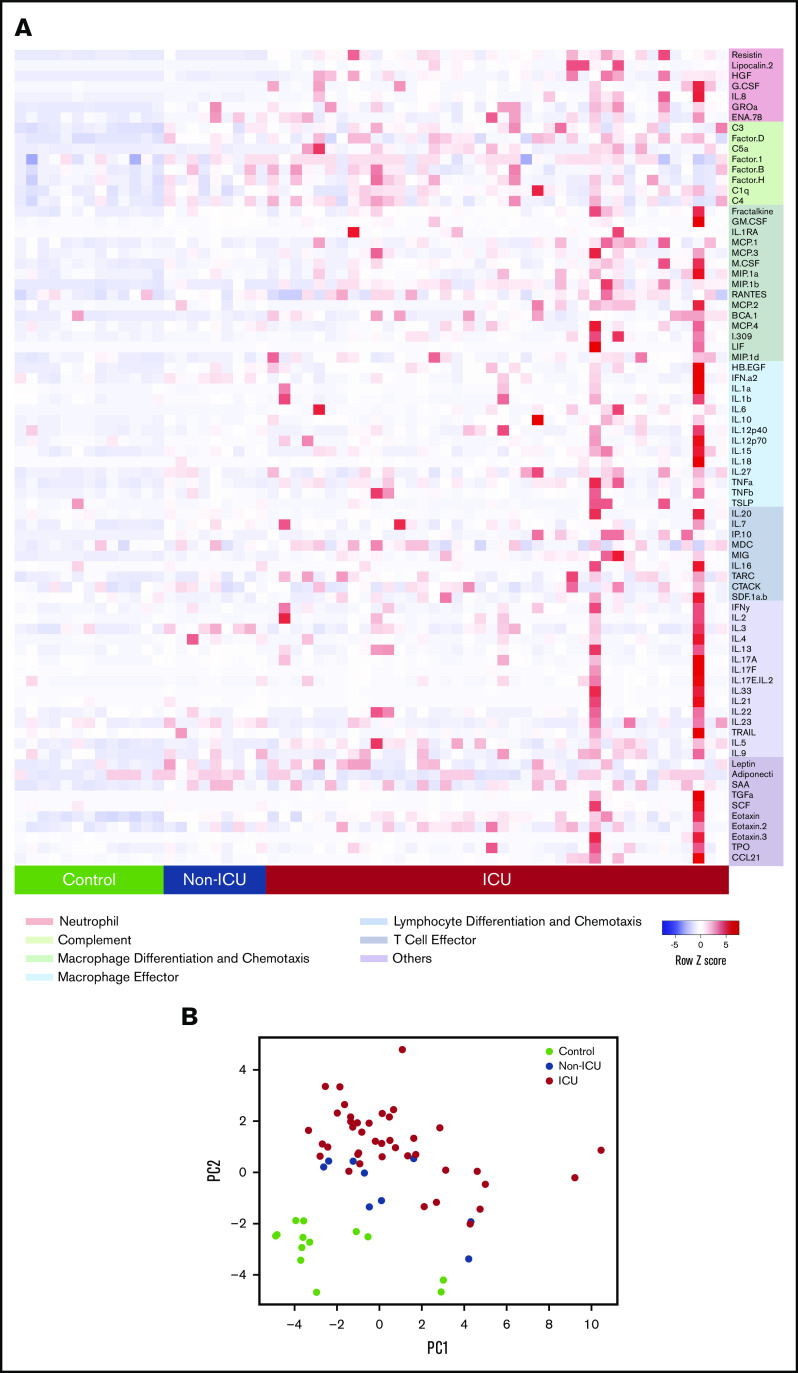
Figure 1.
Circulating biomarkers separate COVID-19 patients according to disease severity. (A) Heatmap of proteomic data from the cross-sectional cohort, indicating relative protein levels detected in each subject (columns) for all biomarkers tested (rows). Proteins are categorized by biological function. (B) Visualization of the first 2 principal components (PCs) of a PCA of all biomarker data for each subject.

