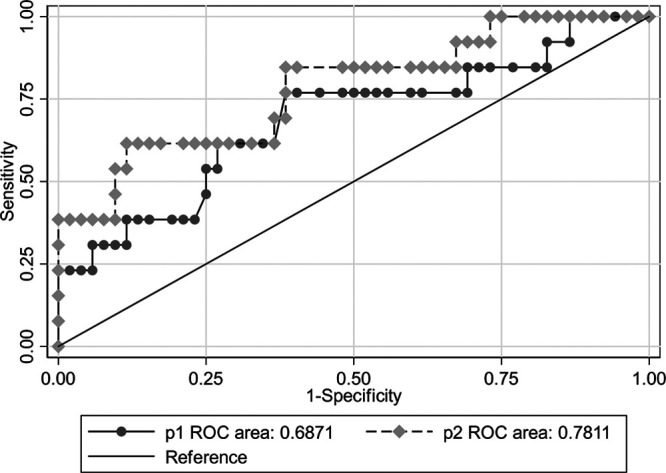
Fig. 3.

Receiver operating characteristic curve of LSM and ΔLSM predicting histological fibrosis regression. P1: the LSM indicator alone; P2: the combination of ΔLSM and LSM. Cutoff values of liver stiffness measurements obtained the Sensitivity >90%, maximizing Youden’s index, Specificity >90%. AUROC, the area under the receiver operating characteristic; CI, confidence interval; LSM, liver stiffness measurement; NLR, negative likelihood ratio; NPV, negative predictive value; PLR, positive likelihood ratio; PPV, positive predictive value.
