
Figure 3.
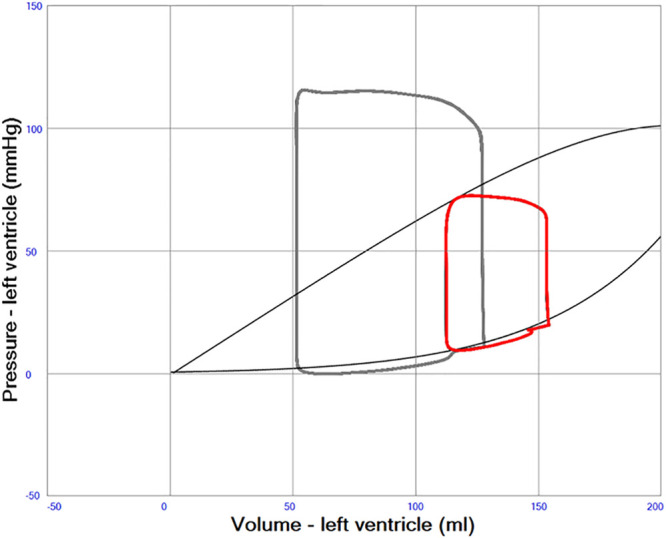
A left ventricular pressure–volume (PV) loop in red illustrating severe systolic left heart failure with an ejection fraction of about 20%. Normal PV loop in gray. End-systolic and end-diastolic pressure volume relations indicated with gray curves. The curved part of the end-systolic line at high volumes represents overstretching of left ventricular myocardium.