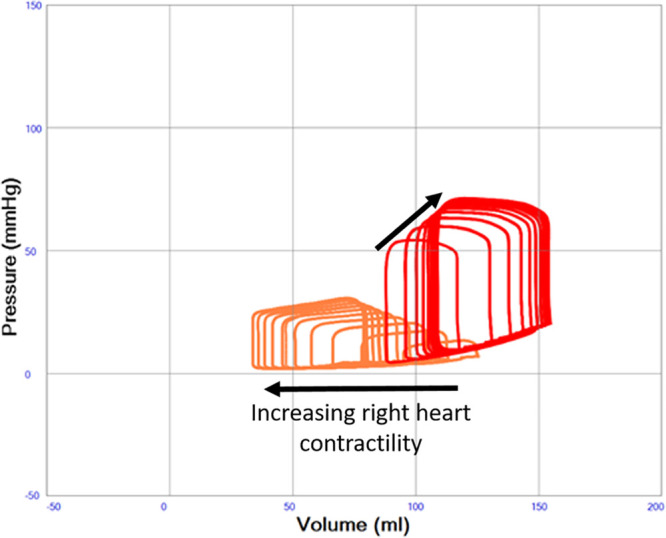
Figure 6.

Left ventricular pressure–volume (PV) loops illustrating severe systolic left heart failure (red loops, end-systolic elastance constant 0.6 mm Hg/ml) with variable right heart function (orange loops, end-systolic elastance increasing from 0.1 to 1.0 mm Hg/ml in the direction of the arrow). A progressive dilatation of the left ventricle with increasing end-diastolic pressure is seen with increasing right heart function.
