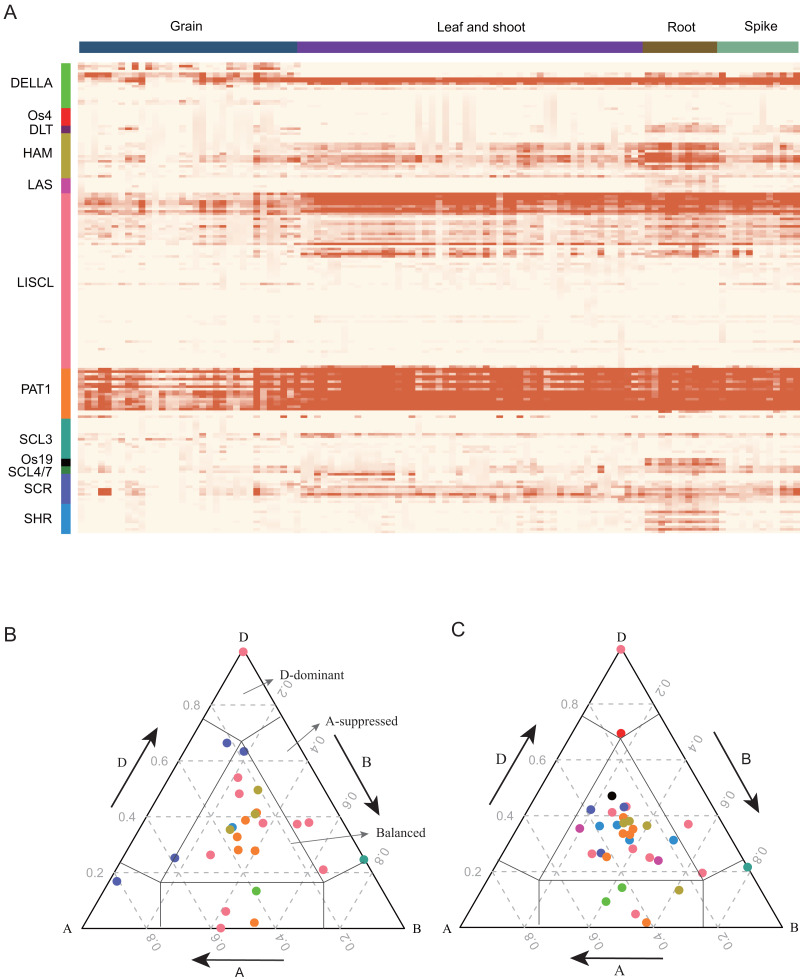
Figure 4. Expression pattern (TPM) of TaGRAS.
(A) Gene expression profile of TaGRAS in different developmental stage. Heatmap was generated with R package “pheatmap” using parameter scale=“none”. The TPM datas was shown in Table S4. (B) Ternary plot showing relative expression abundance of TaGRAS for triads with 1:1:1 ratio in leaves. Each circle represents a gene triad, and its A, B and D coordinates consist of the relative contribution of each homologous gene to the expression of the overall triad. Triads in vertices means single-subgenomic-dominant class, for example the D-dominant region, while triads near edges and between vertices indicated suppressed classes, for example the A-suppressed region. Triads in the center region indicated balanced category. The color of each subfamily was same with color bar in (A). (C) Ternary plot showing relative expression abundance of TaGRAS for triads with 1:1:1 ratio in roots.

