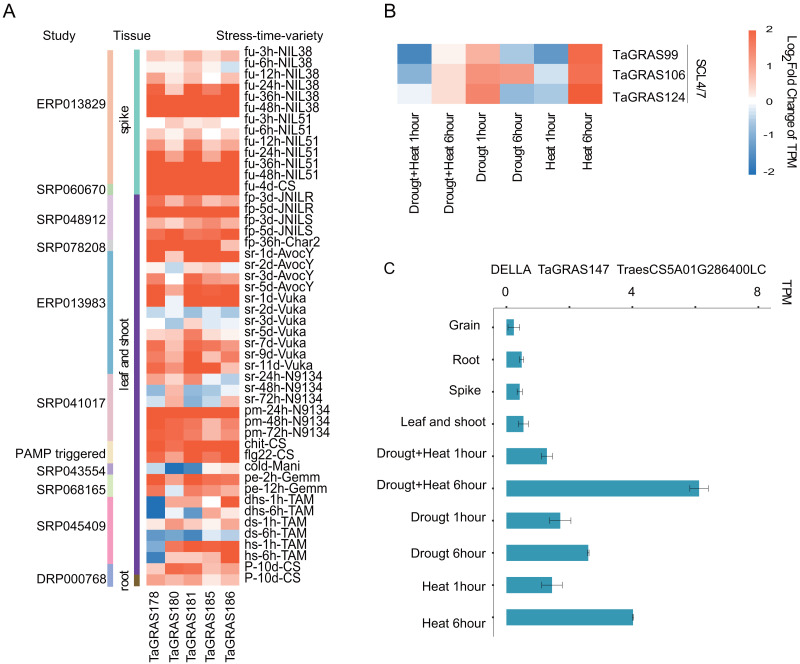
Figure 5. Expression pattern of TaGRAS under abiotic and biotic stresses.
(A) Expression level change of five genes from LISCL subfamily under stresses. The original data accession number and the tissues were shown. fu: fusarium graminearum inoculation; fp: fusarium pseudograminearum inoculation; sr: stripe rust pathogen; pm: powdery mildew pathogen; chit: chitin (1 g per liter) treatment; flg22: flg22 (500 nM) treatment; cold: cold 2 weeks (4); pe: PEG 6000; dhs: drought and heat stress; ds: drought stress; hs: heat stress; P: phosphorous starvation 10 days. (B) Expression level change of SCL4/7 subfamily genes under heat or/and drought stresses. (C) Expression level of TaGRAS147 in different tissue and abiotic stresses. The TPM datas were shown in Table S5.

