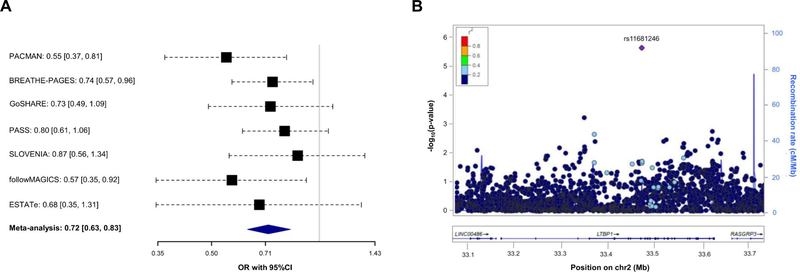
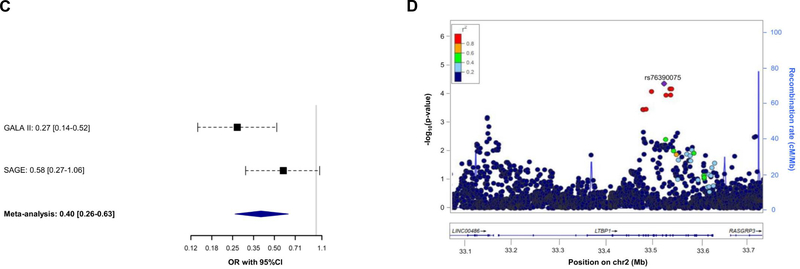
Figure 2. Association results with asthma exacerbations despite ICS treatment for LTBP1.
Forest plot of association effects of the SNPs rs11681246 (panel A) across the European studies and rs76390075 (panel C) in non-European studies. The effects are shown in terms of OR for the effect alleles (G and C, respectively) for each study and after performing a meta-analysis of the results by black boxes and a blue diamond, respectively. The 95% CI are represented by black dash lines. Results are not provided for BREATHE since this SNP did not pass quality control checks in this study.
Regional plot of association results with asthma exacerbations despite ICS use among Europeans (panel B) and non-Europeans (panel D). The y-axis represents the logarithmic transformation of the association results (-log10 p-value) by chromosome position (x-axis) for each SNP as a dot. The diamond corresponds to the most significant variant after Bonferroni-like correction; the remaining SNPs are color-coded based on pairwise linkage disequilibrium (r2 values) with that SNP for Europeans (panel B) or Admixed American populations (panel D) from 1KGP (GRCh37/hg19 build).


