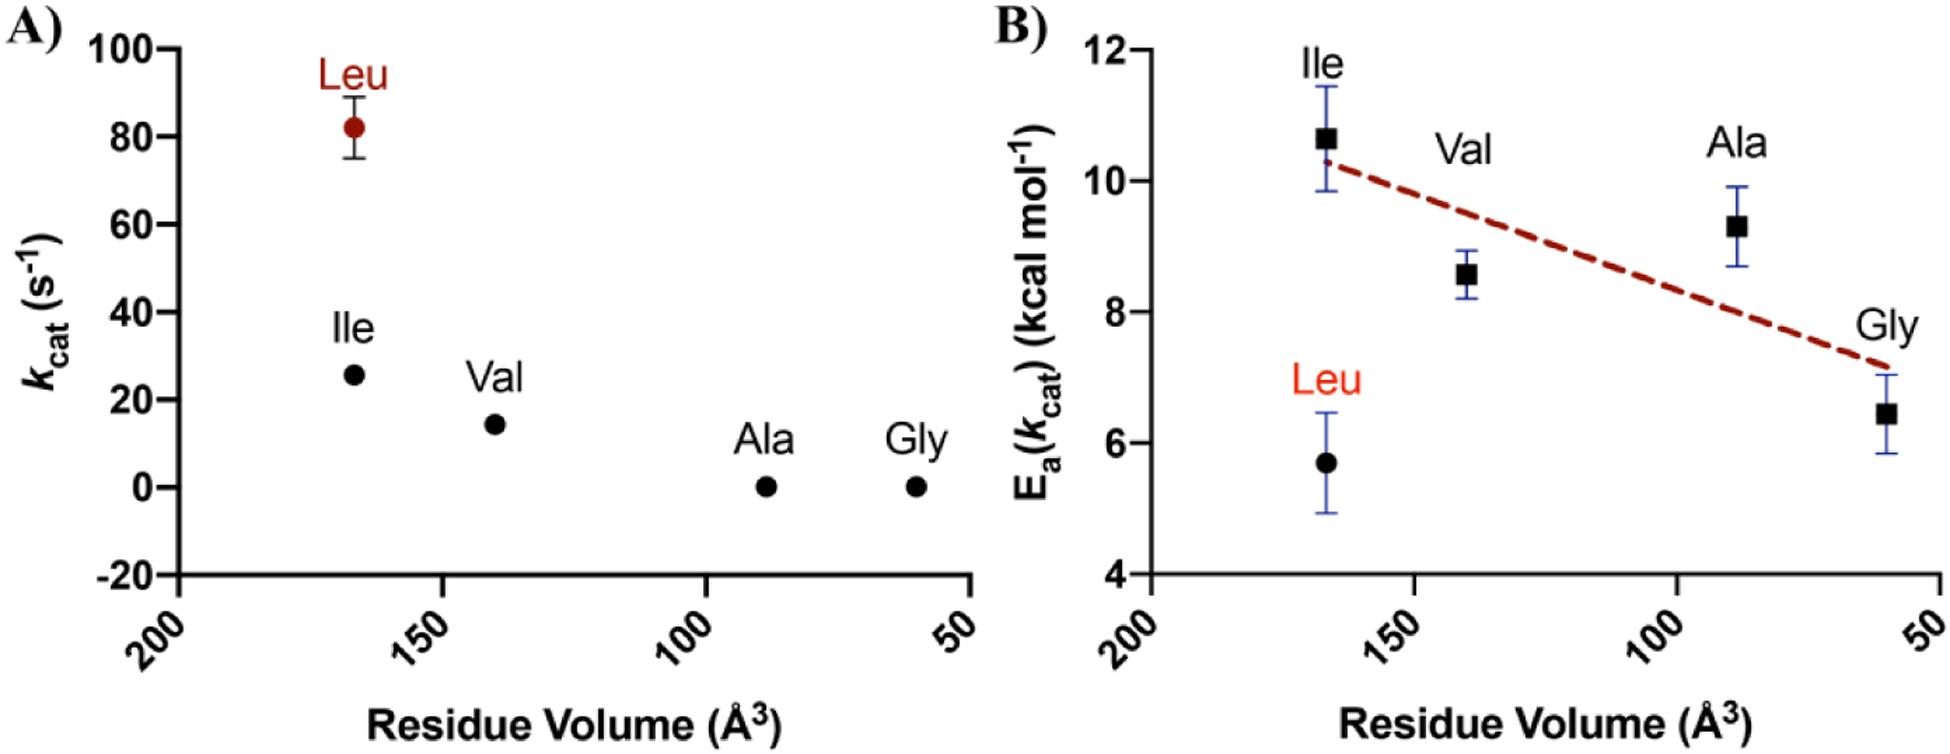
Figure 4.

A) kcat, and B) Ea(kcat) plotted as a function of the volume of the mutated residue at Leu343. The native enzyme (Leu343) is noted in red. The x-axes go from large to small values. Error bars indicate the standard deviation. The dashed line indicate the trend in Ea(kcat) for variants at position 343. Plots of ΔH‡ vs. Residue Volume show the same trend (Figure S11).
