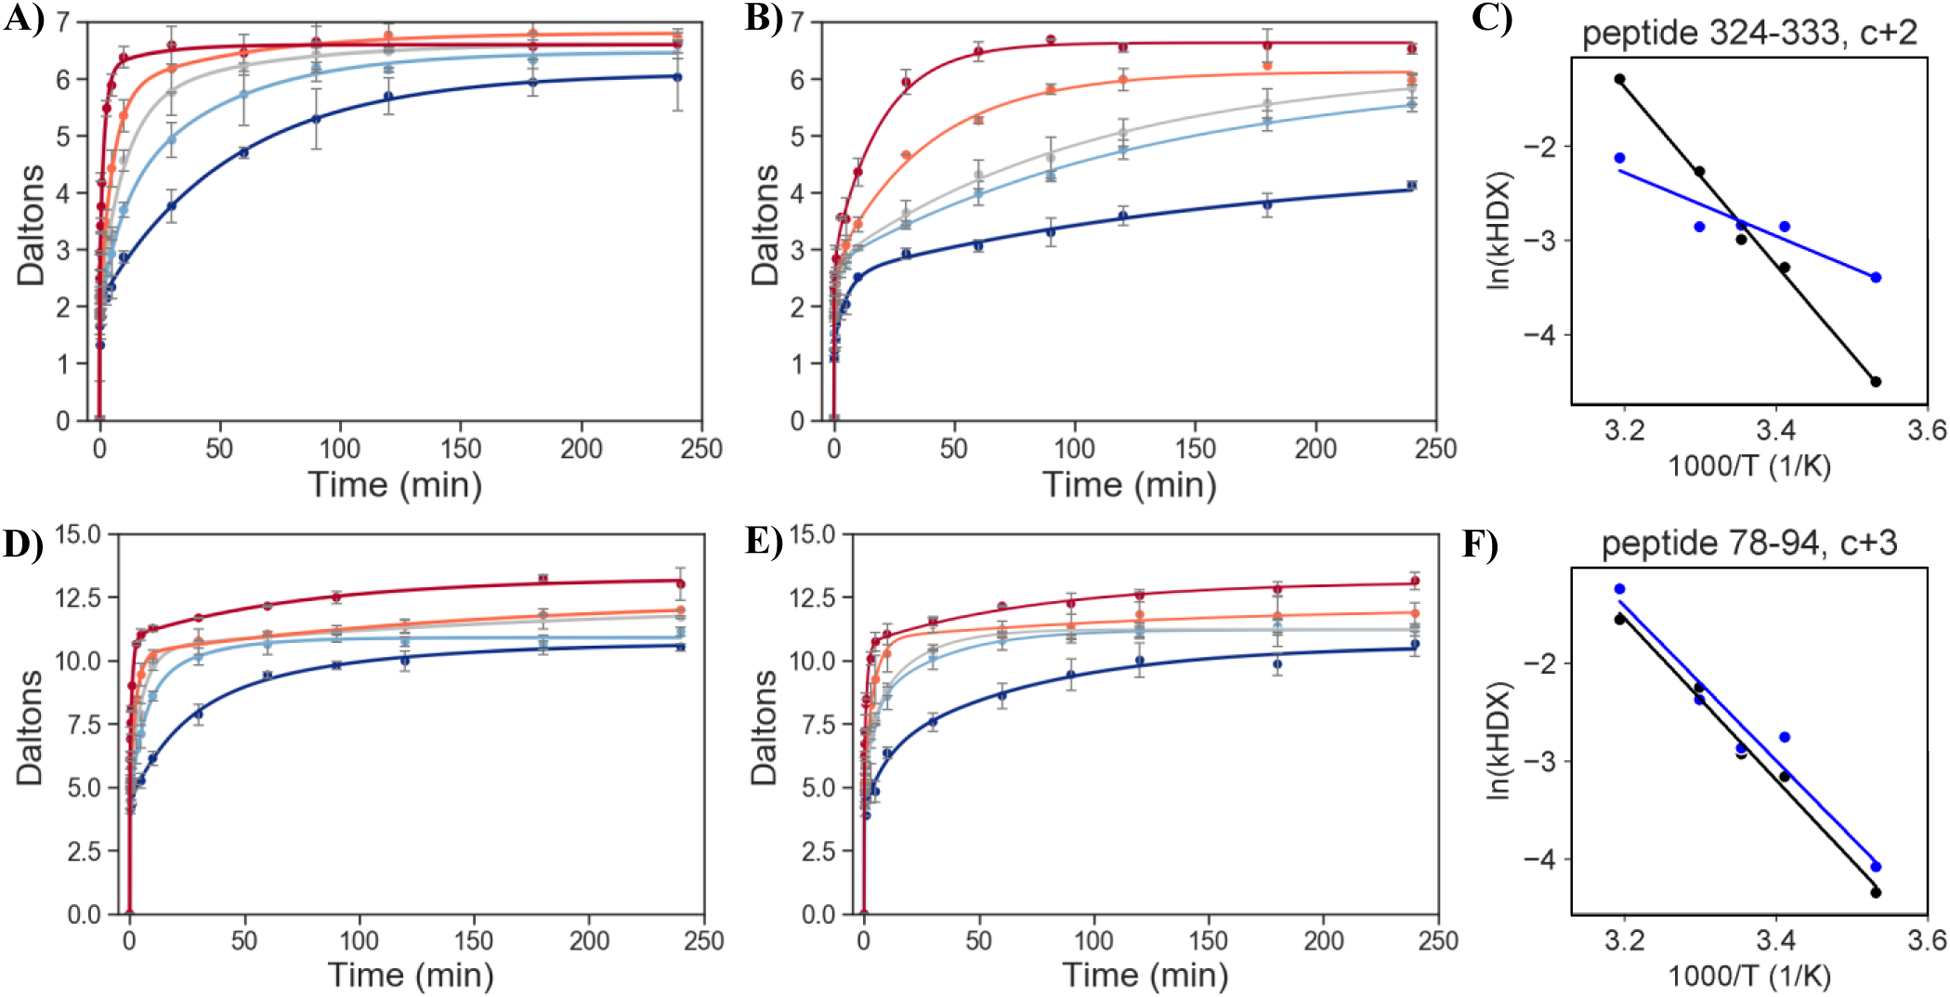
Figure 7.

Examples of changes in Ea(HDX) for Leu343Ala in relation to WT. Peptide 324–333 (A-C) is an example of a large ΔEa(HDX) and peptide 78–94 (D-F) is an example of a negligible ΔEa(HDX). HDX uptake plots showing the increase in deuterated amide sites in peptide versus time at different temperatures for A,D) WT and B,E) Leu343Ala. Colors denote the different temperatures (40 °C, red; 30 °C, orange; 25 °C, grey; 20 °C, light blue; and 10 °C, dark blue), and data are fit to Eq 3. C, F). Comparative plots of ln[(Bkmed+Ckslow)/Ntot], as defined in Eq 4, versus inverse temperature, with WT and Leu343Ala indicated in black and blue, respectively. A compilation of the full set of HDX plots is presented in the Dataset SI.
