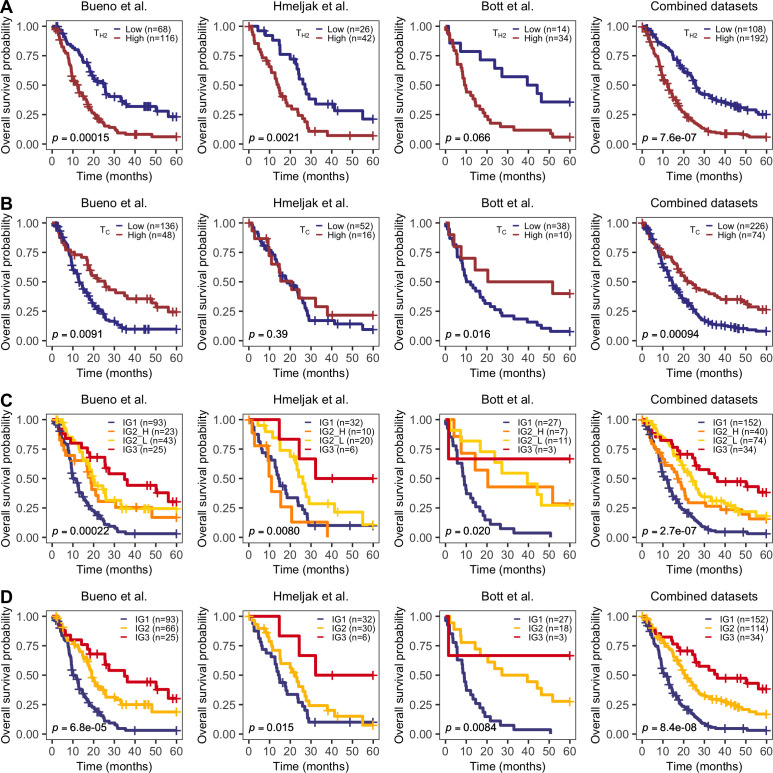
Figure 1.
Overall survival by significant immune fractions. Kaplan-Meier curves of T-helper 2 cells (A), cytotoxic T cells (B), the combination of both fractions in four groups (C), and in three groups (D). HR and p values come from a Cox proportional-hazards model adjusted for age, sex, stage, and histology.

