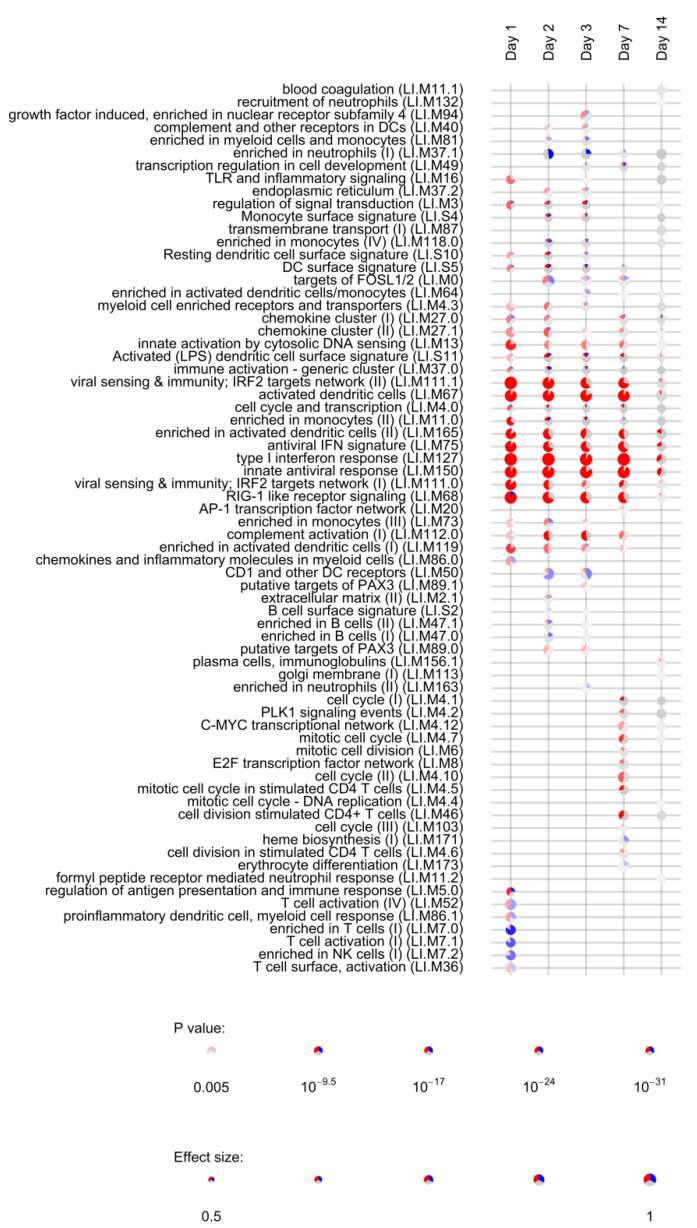
Figure 3.
Activation of blood transcription modules by rVSVΔG-ZEBOV vaccination. Each column represents a study day after vaccination. Activation of modules was tested using the false discovery rate (FDR)-ranked lists of genes generated by edgeR glmTreat fitting and applying the CERNO test. Rows indicate different blood transcription modules, which were significantly (FDR < 0.005) activated in at least one time point. Each module is represented by a pie in which the proportion of significantly upregulated and downregulated genes is shown in red and blue, respectively. The grey portion of the pie represents genes that are not significantly differentially regulated. The significance of module activation is proportional to the intensity of the pie, while the effect size (Area Under the Curve) is proportional to its size.

