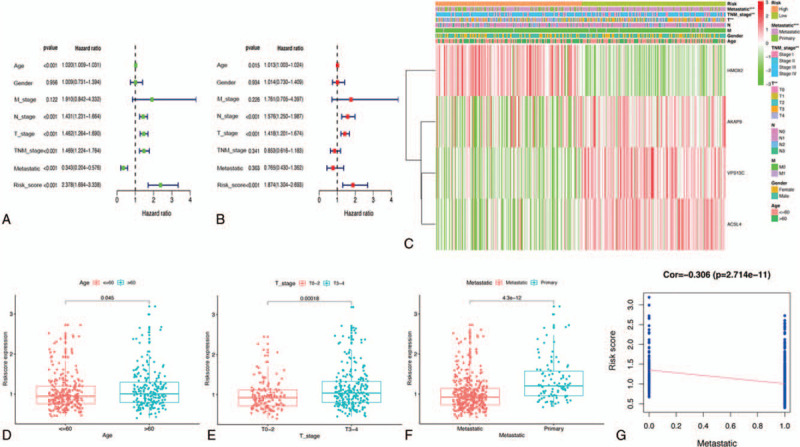
Figure 10.

Efficacy evaluation of constructed prognostic model in TCGA cohort. Univariate (A) and multivariate (B) Cox regression analysis of the clinicopathological features. (C) The heatmap shows the distribution of clinicopathological features and OS genes expression in two risk subgroups. (D-F) The relationship between the risk scores and clinicopathological features. (G) Correlation test between the risk score and cancer metastasis. TCGA = the Cancer Genome Atlas.
