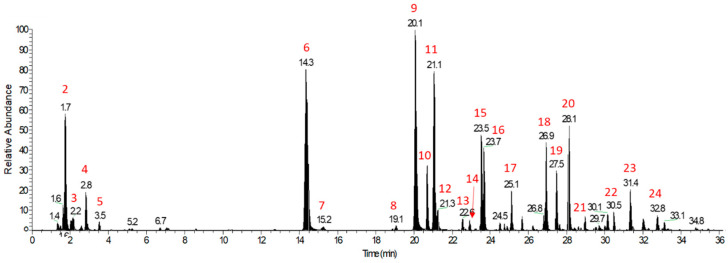
Figure 1.
LC–MS base peak chromatogram (BPC) profile of whole coffee cherry extract (WCCE), adapted from the work of Nemzer and colleagues (under review) [27]. The major detected peaks were labelled with peak numbers ranging from 1 to 24, and the compounds corresponding to each peak are identified here: 1. gluconic acid; 2. quinic acid; 3. malic acid; 4. citric acid; 5. 2-hydroxyglutaric acid; 6. 3-O-caffeoylquinic acid (3-CQA); 7. protocatechualdehyde; 8. 3- coumaroylquinic acid (3-CoQA); 9. 5-CQA; 10. 3-feruloylquinic acid (3-FQA); 11. 4-CQA; 12. caffeic acid; 13. 5-CoQA; 14. 4-CoQA; 15. 5-FQA; 16. 4-FQA; 17. quinic acid-glucoside-R*; 18. 3-dicaffeoylquinic acid (3-DiCQA); 19. 5-DiCQA; 20. 4-DiCQA; 21. 3-Caffeoyl-5-FQA; 22. valeroylquinic acid (VQA) diglucoside-R*; 23. caffeoyl tryptophan; and 24. dimethylcaffeic acid. Other compounds identified in WCCE in the positive ion mode include pantothenic acid, trigonelline, choline, and glycerophosphocholine derivatives. Figure adapted from the work of Nemzer et al. (under review) [27]. A listing of the typical polyphenols found in WCCE can be found in Table 1.

