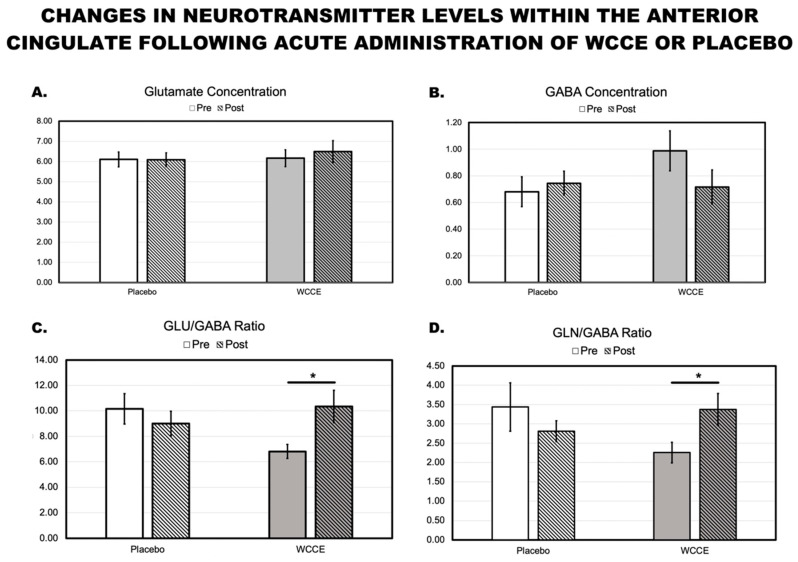
Figure 6.
Bar graph with M ± SEM demonstrating the changes in glutamate, gamma-aminobutyric acid (GABA), and the ratios of glutamate/GABA (GLU/GABA) and glutamine/GABA (GLN/GABA) within the anterior cingulate cortex following the administration of either the placebo or WCCE. Y-axis units of measurement are institutional units. A * indicates significance at the p < 0.05 level for one-tailed t-tests. For descriptive data, please see the supplemental table hosted at https://osf.io/qypr8/. Clear bars represent the placebo, while gray bars represent WCCE. Striped bars indicate post-measurements.

