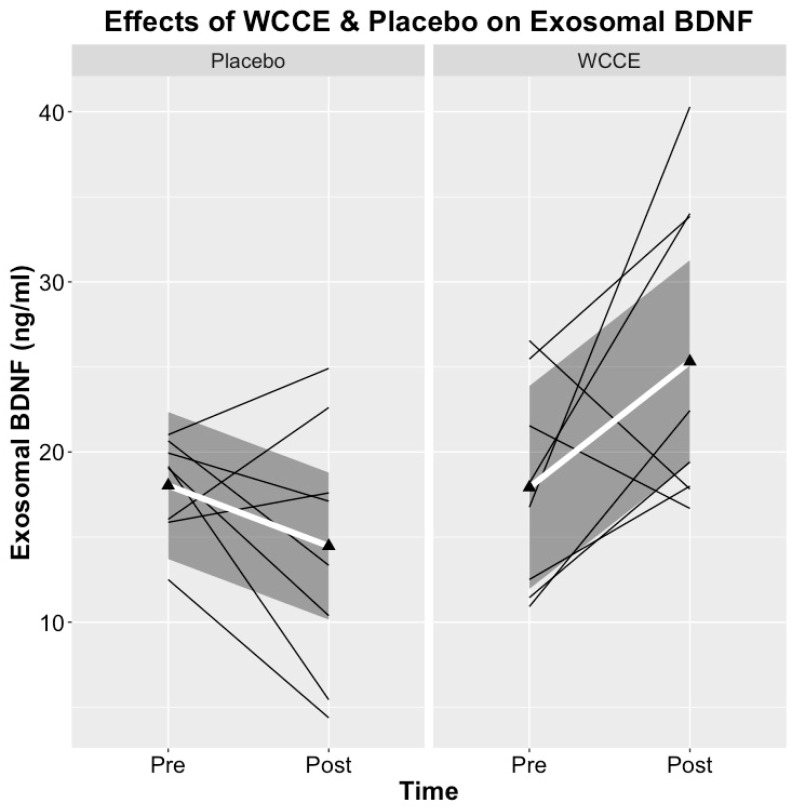
Figure 7.
Pre- and post-consumption data for exosomal brain-derived neurotrophic factor (BDNF). Thin black lines indicate individual participant data, while the thicker white line depicts the group average. The dark gray shading surrounding the white line uses locally weighted regression (loess) for a visualization of group variability. Line graphs were created with open-source software ggplot2 in R.

