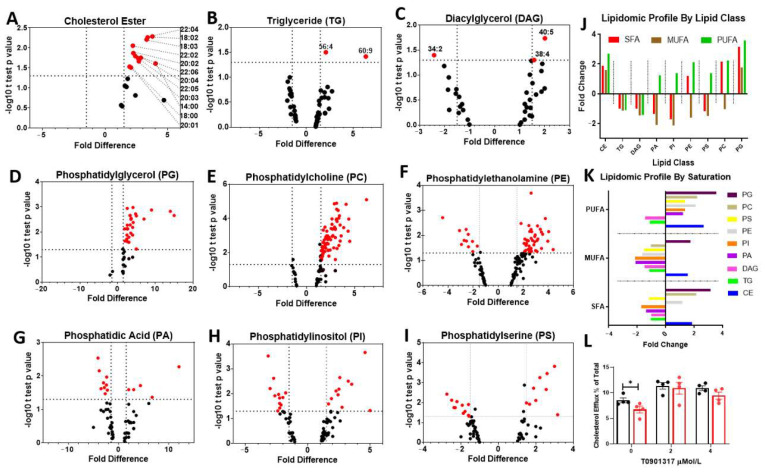
Figure 2.
Relative lipidomics between Control and LPL KD (BV-2) microglia. (A–I). Volcano plots representing lipidomic profiles of CE, TG, DAG, PA, PG, PC, PE, PI, and PS in BV-2 microglia. Significance was determined as a ≥1.5 or ≤−1.5-fold difference in the relative abundance of lipid species in LPL KD vs. control with a p-value ≤ 0.05. (J). Lipidomic profile by lipid class represents the difference in relative abundance of PUFA, MUFA, and SFA in control vs. LPL KD cells. (K). Lipidomic profile by saturation represents the degree of saturation in each lipid class in control vs. LPL KD cells. (L). Cholesterol efflux in control vs. LPL KD cells. where * = p < 0.05.

