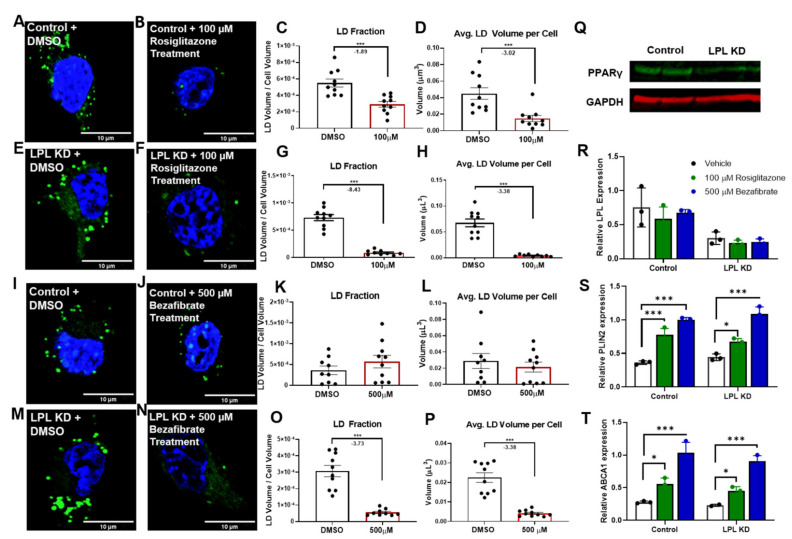
Figure 4.
PPAR agonists rescue LPL KD microglia from LDAM phenotype. (A–P) Confocal microscopy of BV-2 control and LPL KD cells, treated with either vehicle (DMSO), 100 µM rosiglitazone, or 500 µM bezafibrate. Green dye indicates AdipoRed staining of neutral lipids. Blue DAPI staining indicates nuclei. Scale bar: 10 µm. (A–D). Quantitative analysis of relative LD fraction and volume in Control (BV-2) microglia treated with vehicle or 100 µM rosiglitazone. (E–H). Quantitative analysis of relative LD fraction and volume in LPL KD (BV-2) microglia treated with vehicle or 100 µM rosiglitazone. (I–L). Quantitative analysis of relative LD fraction and volume in Control (BV-2) microglia treated with vehicle or 500 µM bezafibrate. (M–P). Quantitative analysis of relative LD fraction and volume in LPL KD (BV-2) microglia treated with vehicle or 500 µM bezafibrate. n = 10 per group. (Q). Western blot showing PPARγ protein expression in 60 μg of total protein from either control or LPL KD cells. (R–S). Quantification of PPAR target genes in control vs. LPL KD BV-2 microglia treated with vehicle 100 µM rosiglitazone or 500 µM bezafibrate. * = p < 0.05, *** = p < 0.001.

