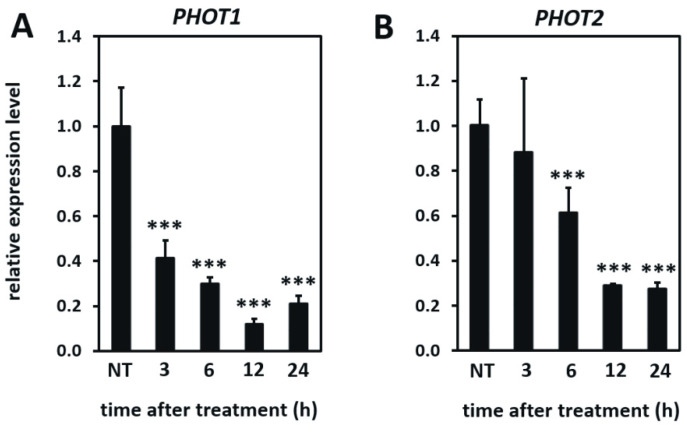
Figure 6.
Relative expression level of PHOT1 (A) and PHOT2 (B) genes in the wild-type plants in non-stress conditions and 3, 6, 12, and 24 h after UV-C exposure. Values are means (±SD) from three biological replicates, for which three individual qPCR reactions were performed (n = 9). Asterisks indicate statistically significant differences from non-treated plants, at the level p < 0.001 (***).

