
Figure 3.
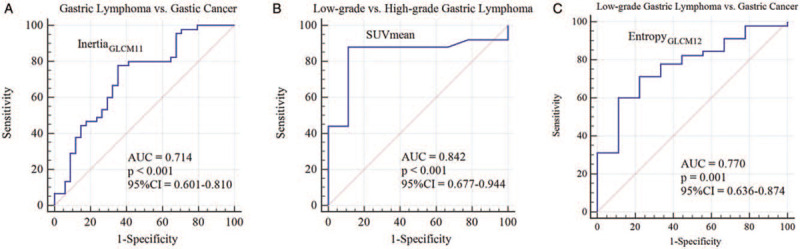
Receiver operating characteristic curves of inertiaGLCM11 (A), SUVmean (B), and entropyGLCM12 (C) in differentiating gastric lymphoma vs. gastric cancer, low-grade vs. high-grade lymphoma, and low-grade gastric lymphoma vs. gastric cancer, respectively. AUC: Area under the curve; CI: Confidence interval; GLCM: Grey-level co-occurrence matrix; SUV: Standard uptake value.