
Figure 1.
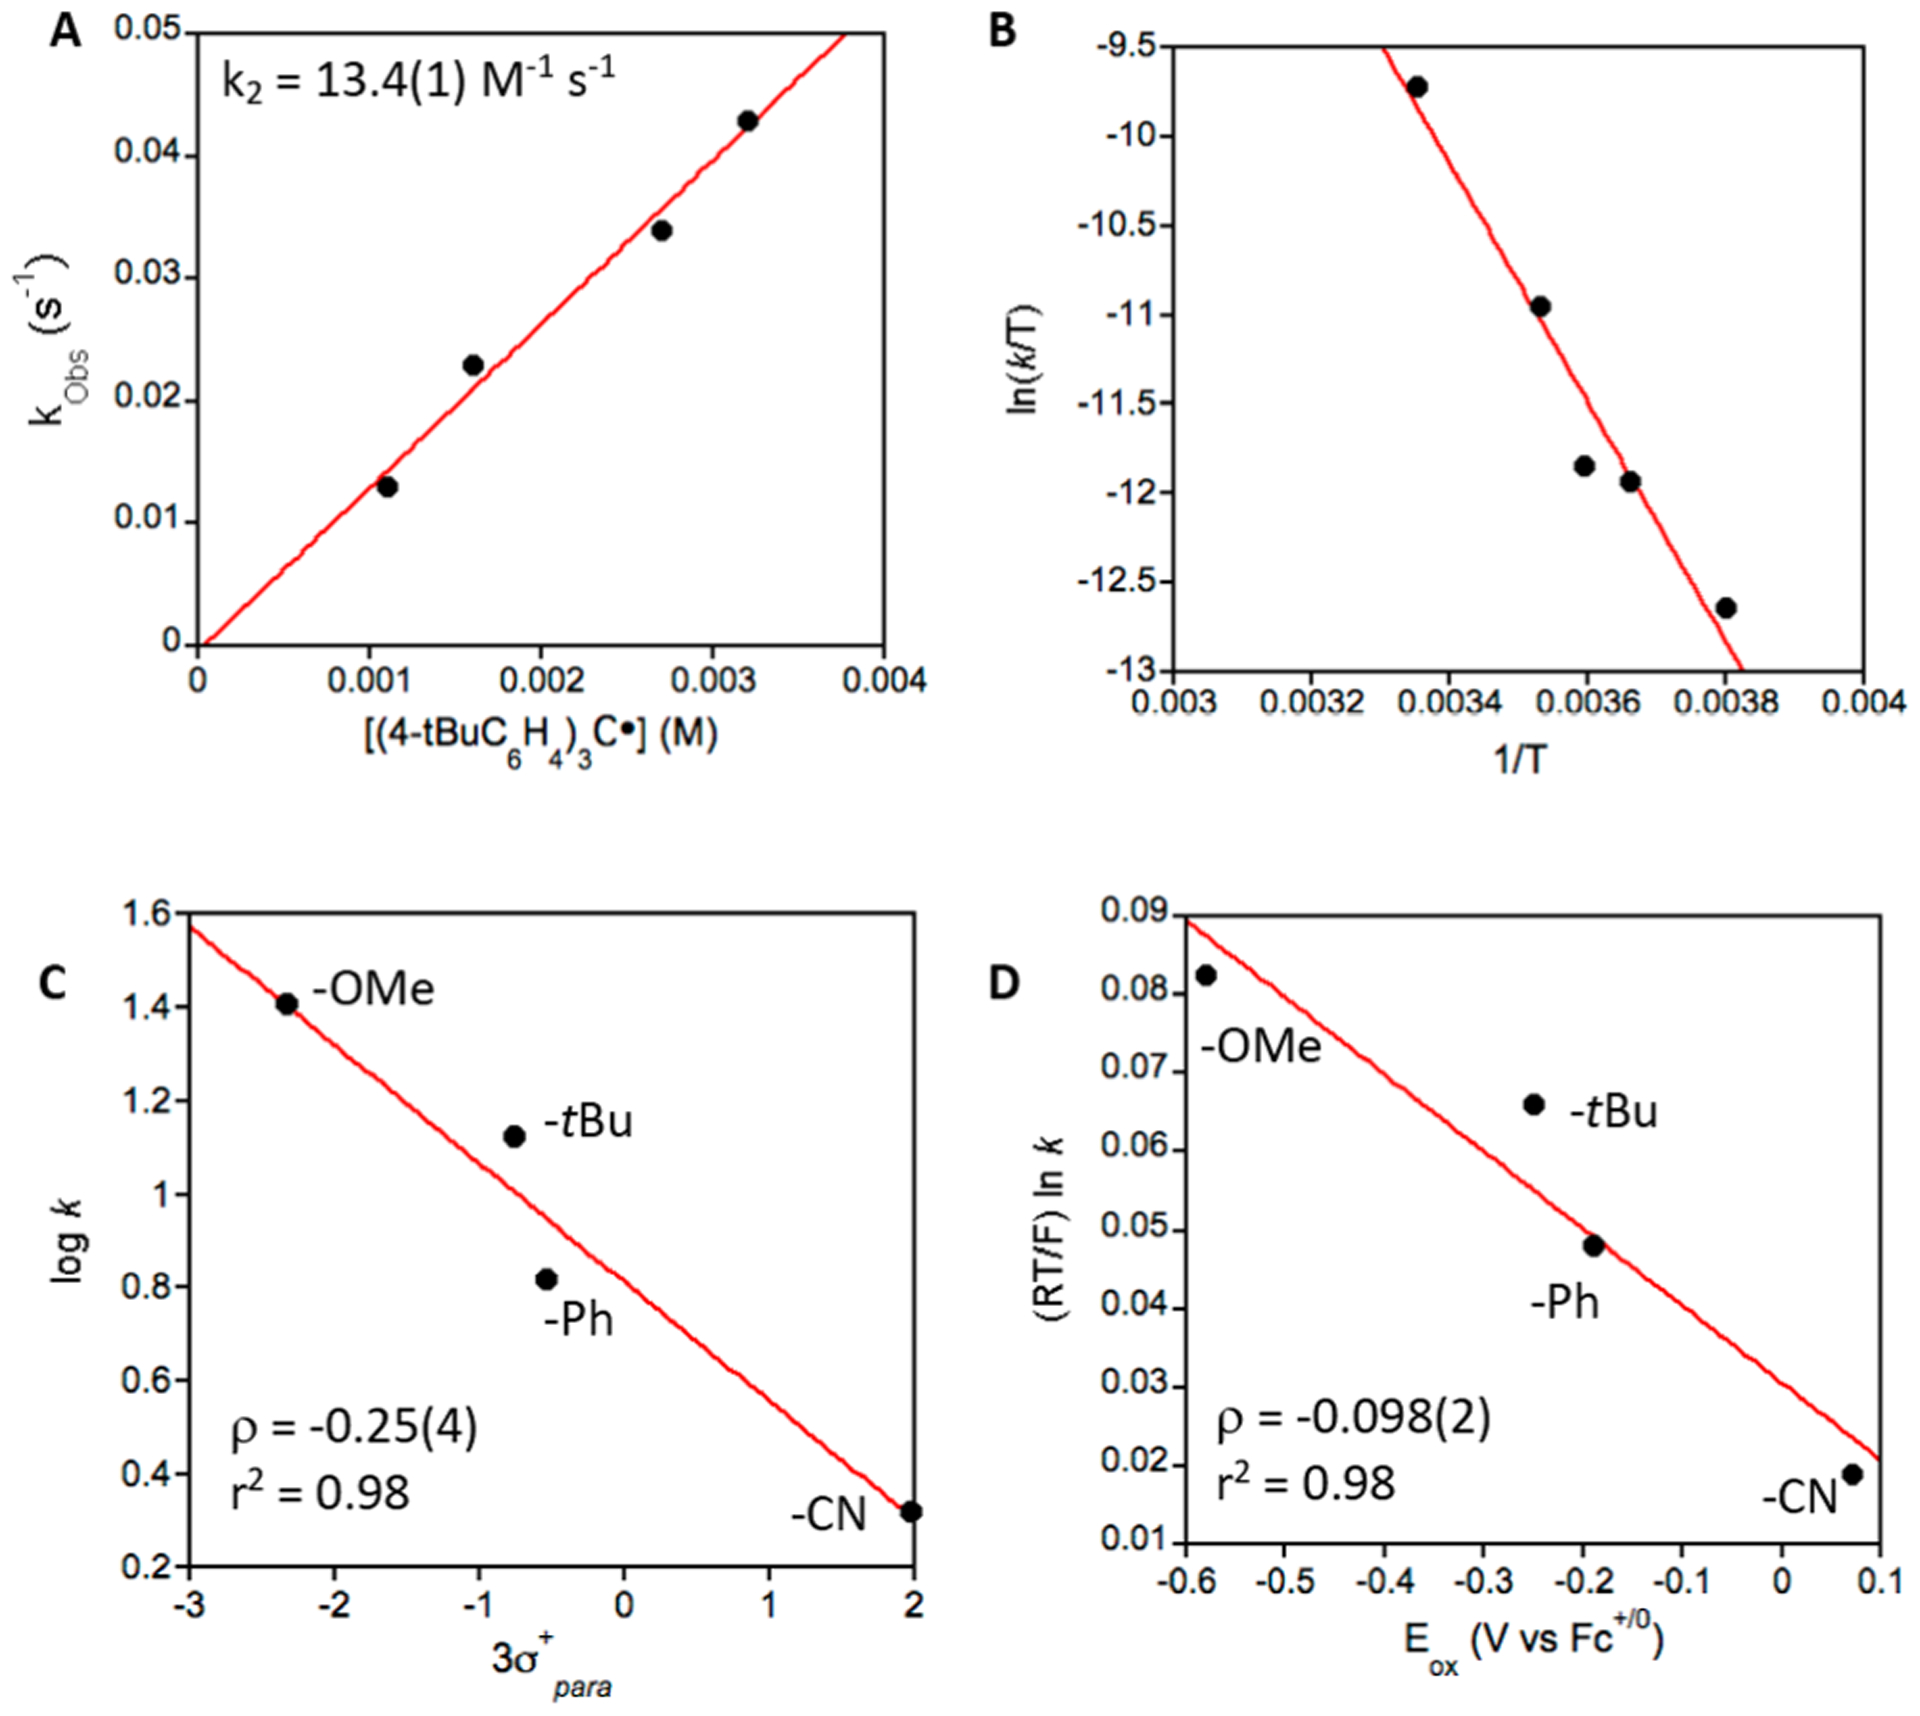
(A) Plot of kobs versus [(p-tBu-C6H4)3C•], where the slope of the best fit (red line) gives k2 = 13.4(1) M−1 s−1. (B) Eyring plot of (ln(kobs/T) vs 1/T for the reaction of 1 and (p-tBu-C6H4)3-C• from −10 °C to 25 °C. (C) Hammett plot. (D) Marcus plot.