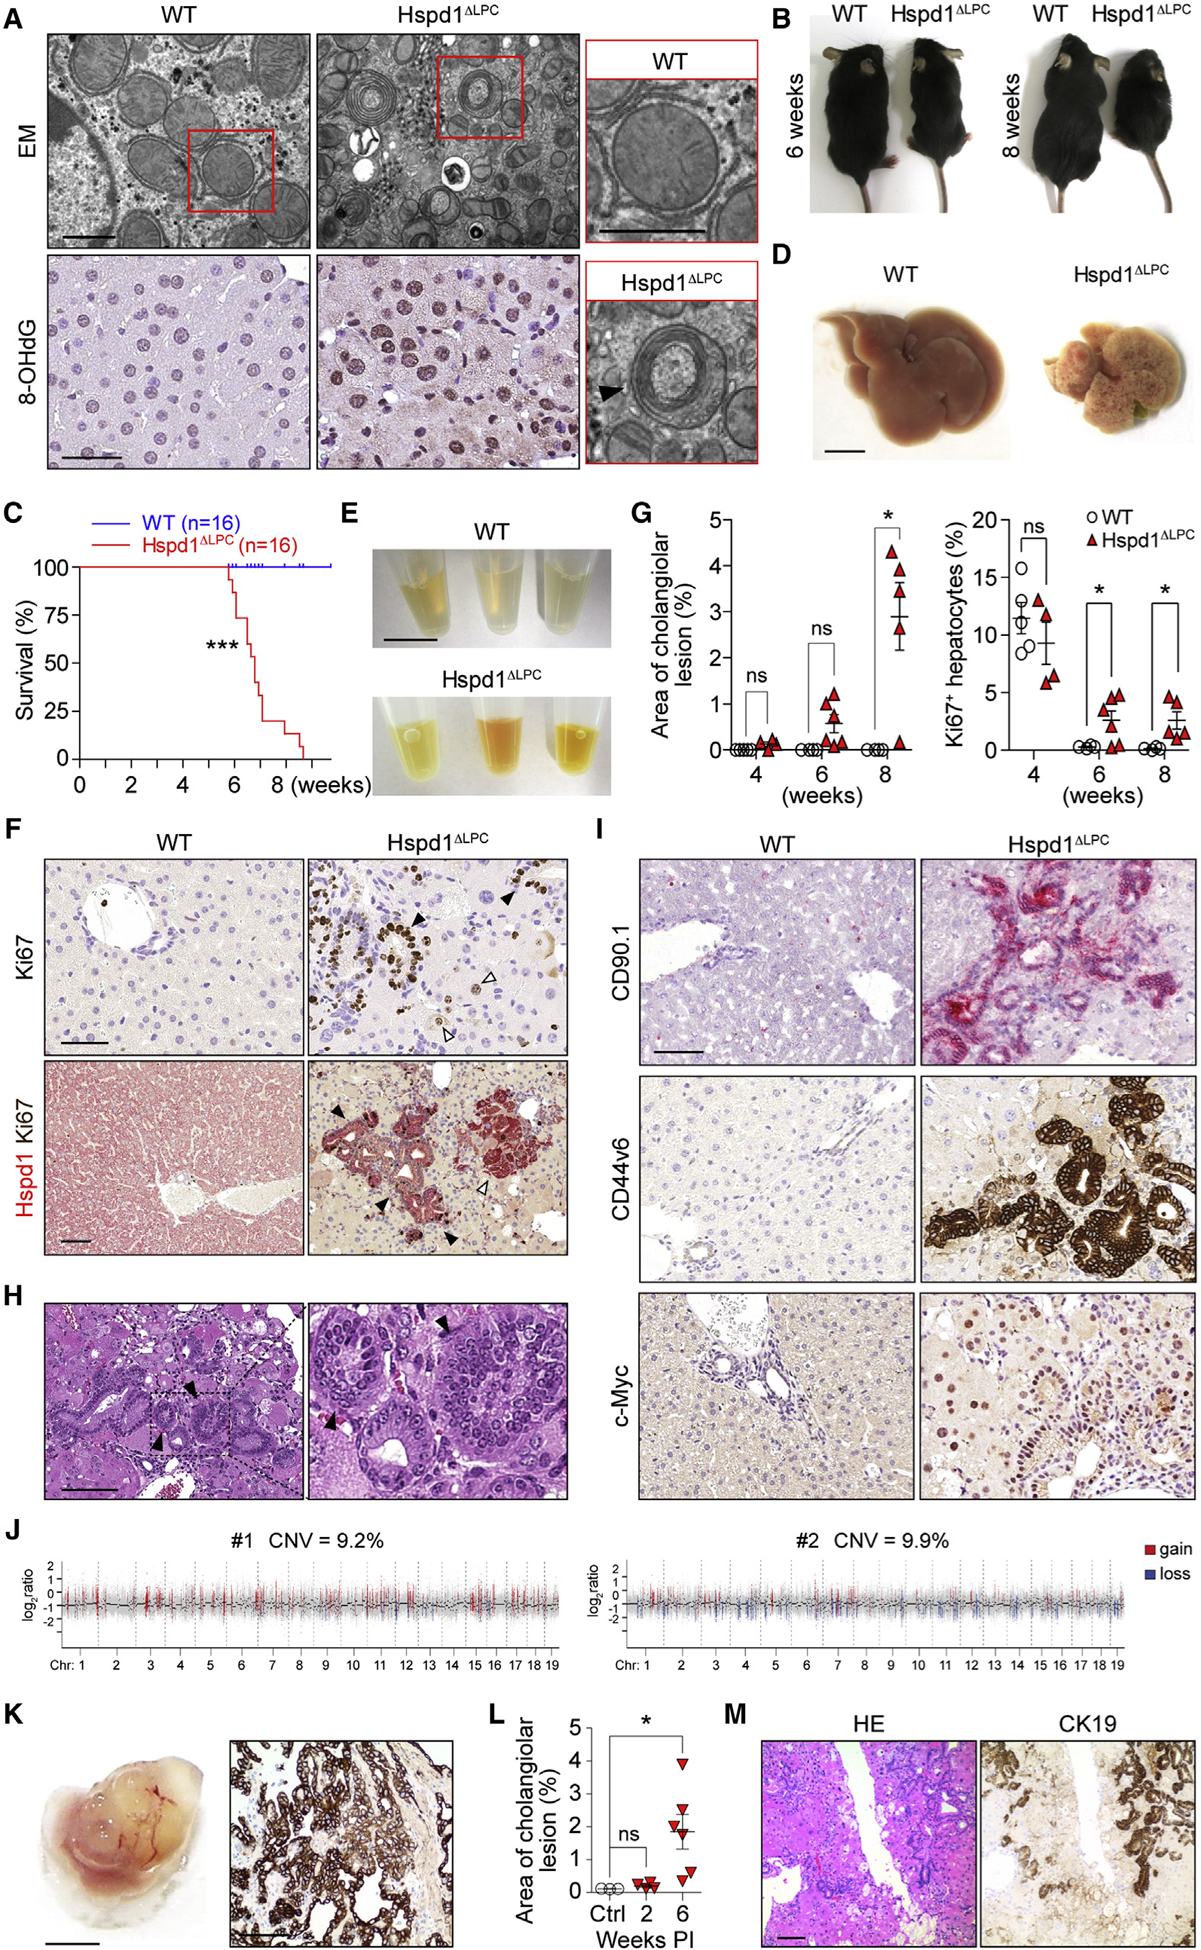
Figure 1. Lack of Hspd1 Causes Acute Liver Damage, Hepatic Proliferation, and Cholangiocellular Tumorigenesis.

(A) Electron microscopy and 8-OHdG staining of WT and Hspd1ΔLPC livers. Arrowhead indicates a classic mitophagosome. Scale bars, 0.5 μm (upper), 50 μm (lower).
(B) Six- and 8-week-old Hspd1ΔLPC mice and WT littermates.
(C) Survival curve of Hspd1ΔLPC and WT mice.
(D) Eight-week-old Hspd1ΔLPC and WT littermate livers. Scale bar, 5 mm.
(E) Serum from 8-week-old Hspd1ΔLPC mice and WT littermates. Scale bar, 1 cm.
(F) Upper: Ki67 staining of 6-week-old Hspd1ΔLPC and WT livers. Black arrowheads, Ki67+ cholangiocytes; white arrowheads, Ki67+ hepatocytes. Lower: double staining of Hspd1 (red) and Ki67 (brown) of 8-week-old Hspd1ΔLPC and WT livers, indicating foci of hepatocyte (white arrowhead) and cholangiocellular (black arrowhead) proliferation. Scale bar, 50 μm.
(G) Quantification of cholangiocellular lesions and Ki67+ hepatocytes over time in Hspd1ΔLPC mice and WT littermates.
(H) H&E staining of Hspd1ΔLPC liver. Arrowheads indicate biliary intraepithelial neoplasia. Scale bar, 100 μm.
(I) IHC analysis in 8-week-old WT and Hspd1ΔLPC livers. Scale bar, 50 μm.
(J) Genomic hybridization profiles of CK19+ cholangiocellular neoplasia.
(K) Macroscopy (left) and CK19 staining (right) of tumor graft from severe combined immunodeficiency Beige liver. Scale bars, 5 mm (left), 100 μm (right).
(L) Quantification of cholangiocellular lesions over time in AAV8-Cre Hspd1loxP/loxP and control mice.
(M) H&E and CK19 staining of AAV8-Cre Hspd1loxP/loxP livers. Scale bar, 100 μm.
Data are represented as the mean ± SEM. *p < 0.05, ***p < 0.001. ns, not significant. See also Figures S1 and S2.
