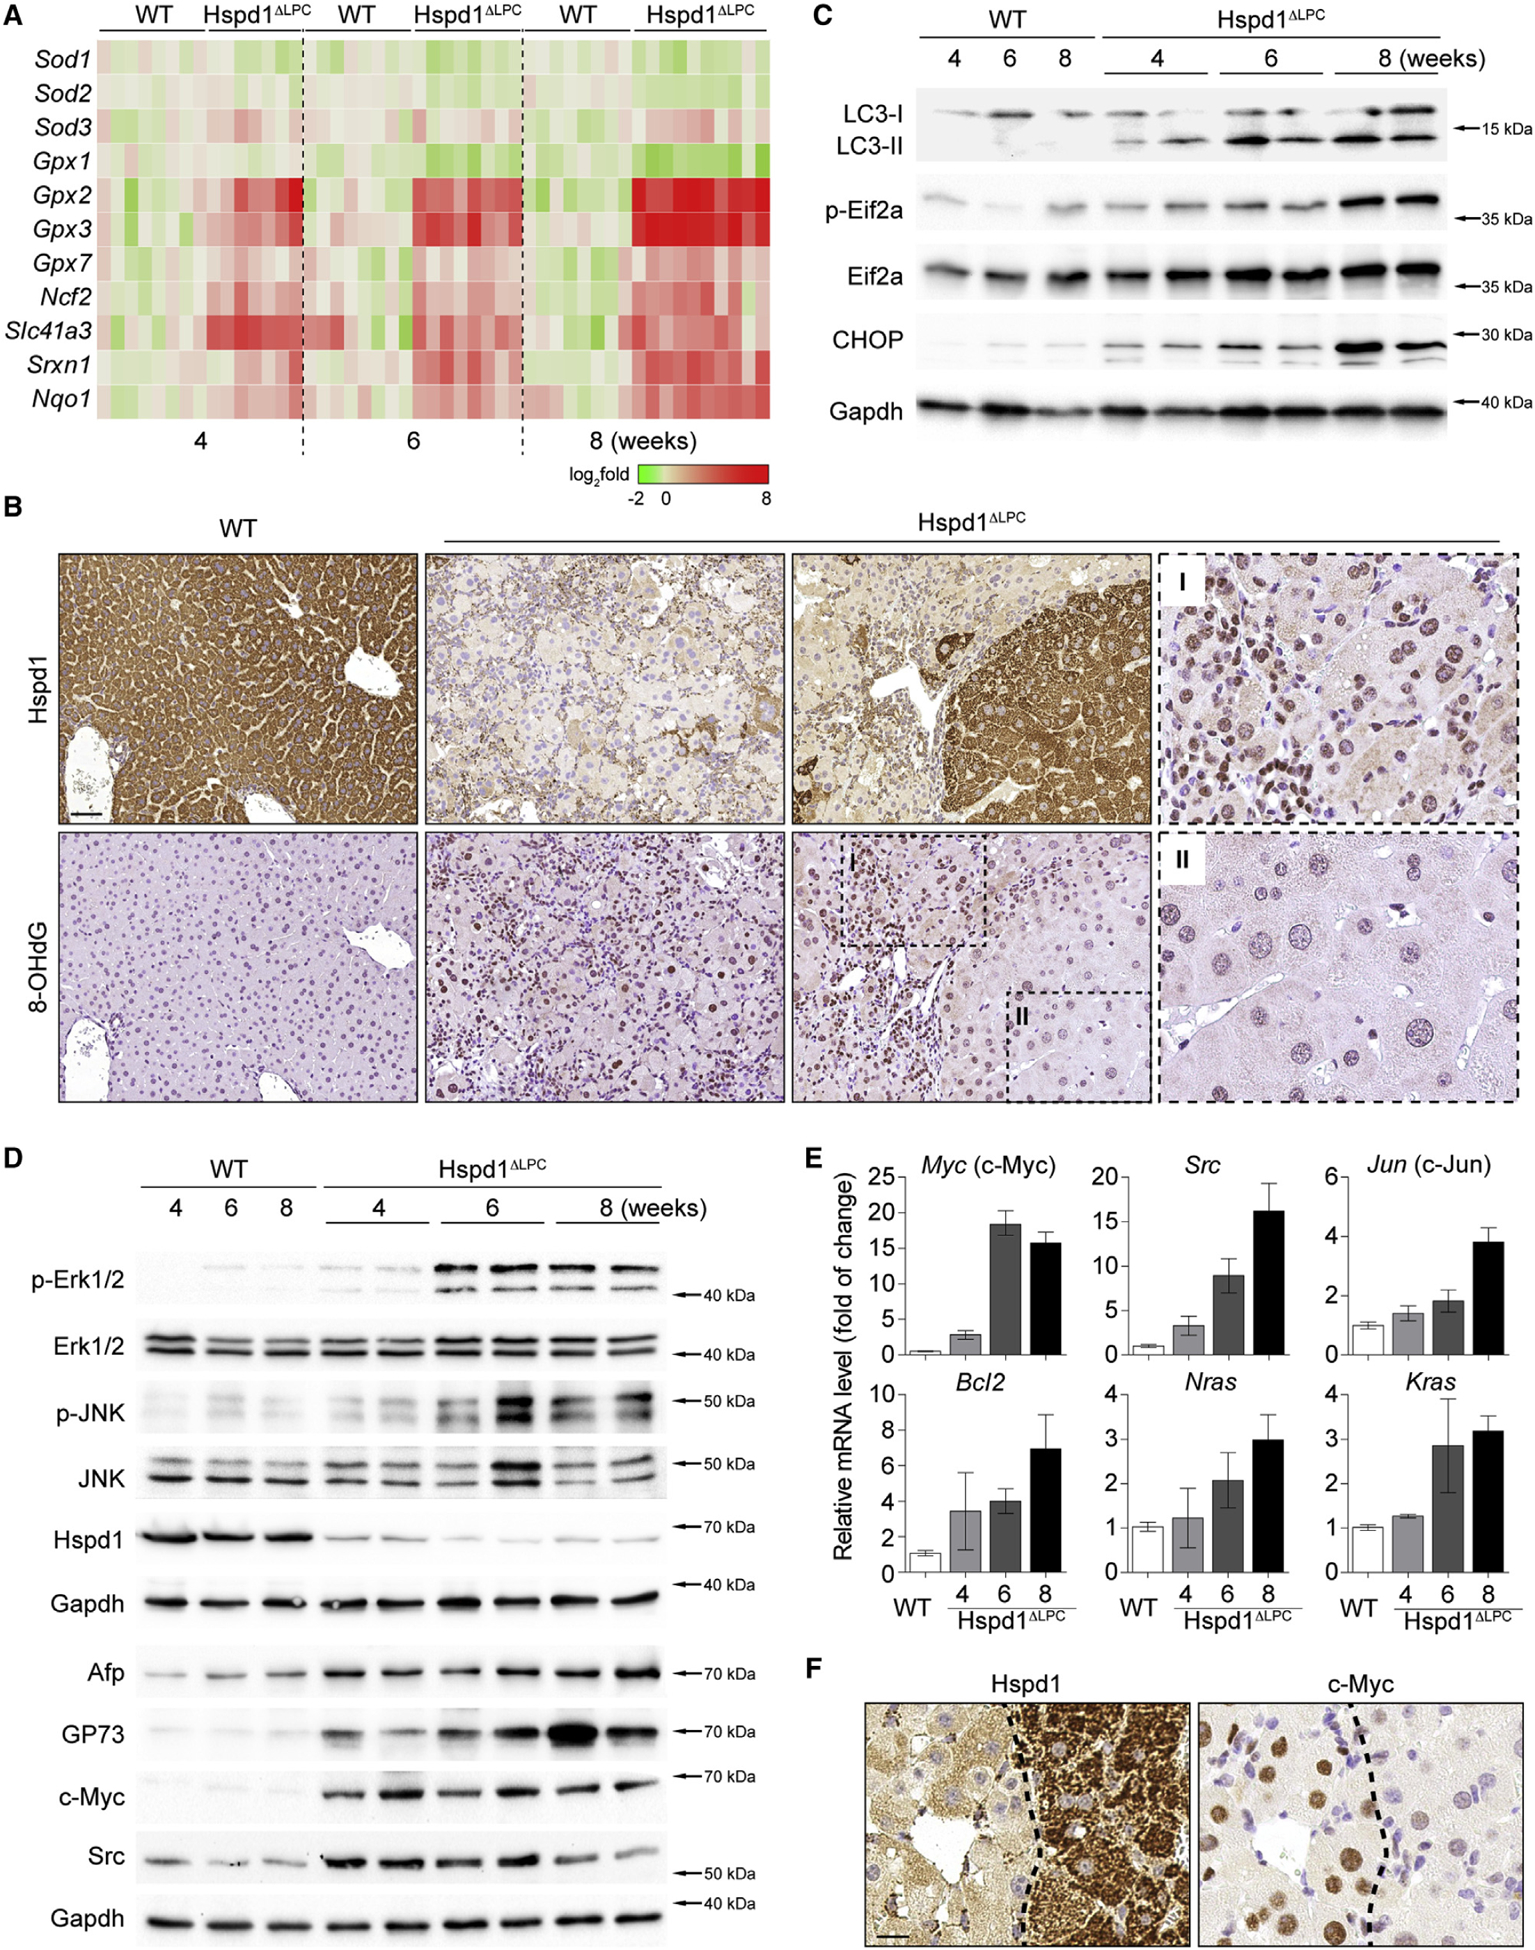
Figure 2. Oxidative and Pro-carcinogenic Liver Microenvironment in Hspd1ΔLPC Mice.

(A) Heatmap of the expression of anti-oxidant genes in Hspd1ΔLPC livers compared with WT over time. Red, upregulated; green, downregulated.
(B) Hspd1 and 8-OHdG staining of 8-week-old Hspd1ΔLPC and WT livers. Scale bar, 50 μm.
(C) Western blot analysis of Hspd1ΔLPC and WT livers from the indicated ages.
(D) Western blot analysis of Hspd1ΔLPC and WT livers from the indicated ages.
(E) qRT-PCR for the top upregulated pro-survival genes in Hspd1ΔLPC liver compared with 8-week-old WT liver. Data are represented as the mean ± SEM.
(F) Hspd1 and c-Myc IHC in consecutive liver sections from 8-week-old WT and Hspd1ΔLPC mice. The dashed lines indicate the border between the Hspd1+ and Hspd1− areas. Scale bar, 20 μm.
See also Figure S3.
