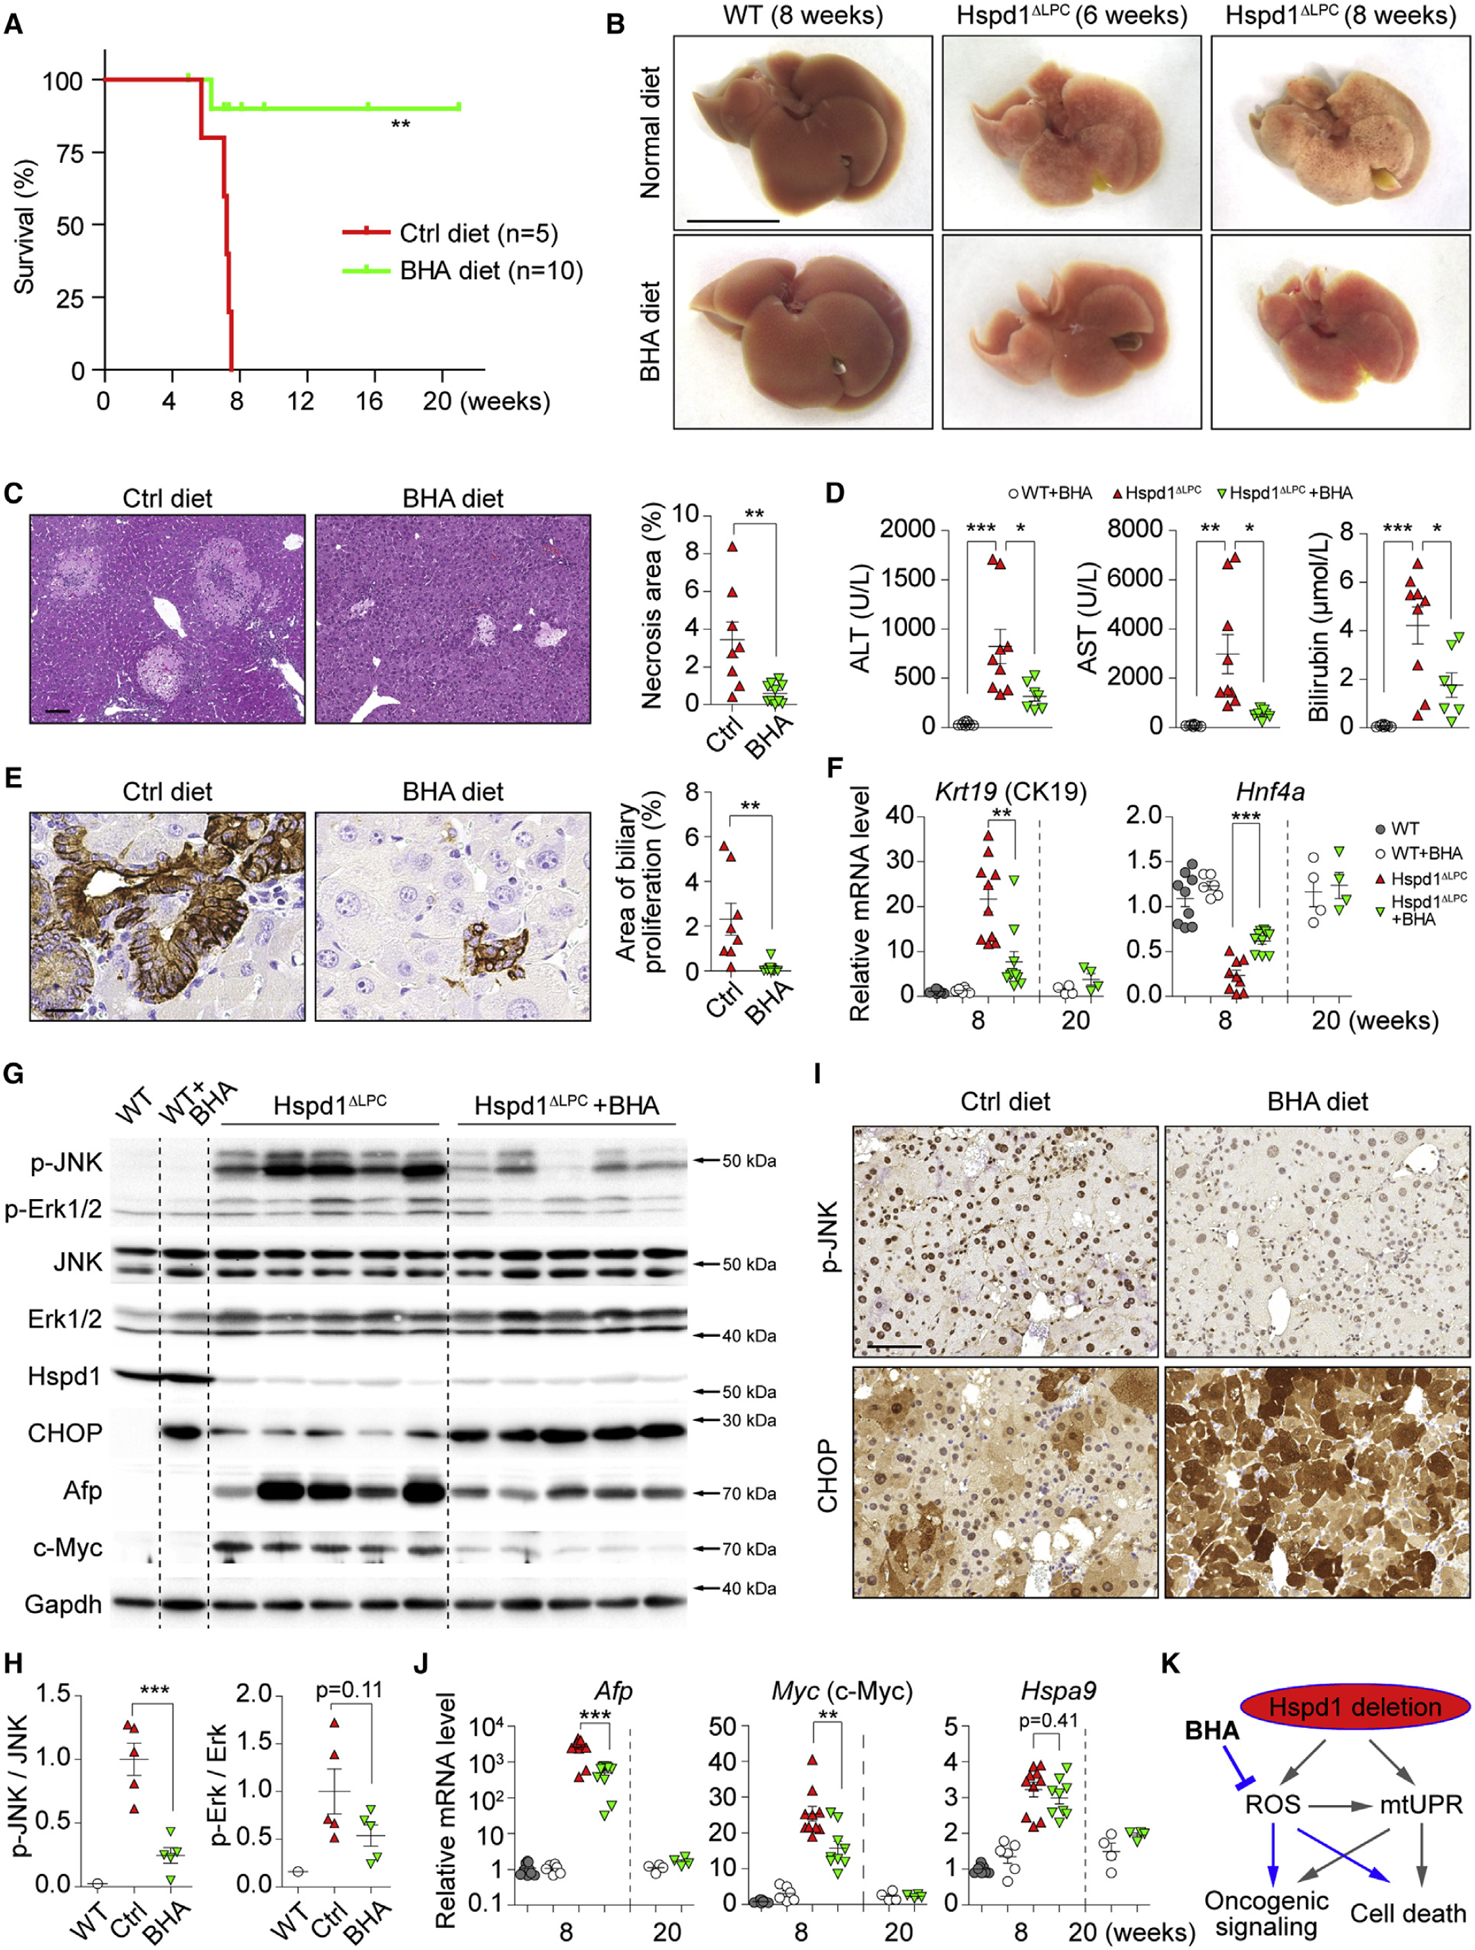
Figure 3. Anti-oxidants Attenuate ROS Accumulation and Premalignant Cholangiocellular Lesions in Hspd1ΔLPC Mice.

(A) Survival plots for Hspd1ΔLPC mice on normal or BHA diet.
(B) Macroscopy of the liver of 6- and 8-week-old Hspd1ΔLPC or 8-week-old WT mice on normal or BHA diet. Scale bar, 1 cm.
(C) H&E of the liver of 8-week-old Hspd1ΔLPC mice on normal versus BHA diet and quantification of necrotic areas. Scale bar, 100 μm.
(D) Serum ALT, AST, and bilirubin in 8-week-old Hspd1ΔLPC mice on normal and BHA diet.
(E) A6 IHC in 8-week-old normal versus BHA diet Hspd1ΔLPC livers and quantification of cholangiocellular overgrowth. Scale bar, 20 μm.
(F) qRT-PCR of livers from 8- and 20-week-old normal versus BHA diet Hspd1ΔLPC mice for CK19 and Hnf4α.
(G and H) Western blot of liver lysates from 8-week-old normal versus BHA diet Hspd1ΔLPC mice (G) and quantifications the p-JNK to total JNK and the p-Erk1/2 to total Erk1/2 ratio (H).
(I) IHC for p-JNK and CHOP in consecutive liver sections from normal versus BHA diet 8-week-old Hspd1ΔLPC mice. Scale bar, 50 μm.
(J) qRT-PCR of livers from 8- and 20-week-old normal versus BHA diet Hspd1ΔLPC mice for genes indicated.
(K) A schematic depicting the action of BHA in Hspd1ΔLPC mice.
Data are represented as the mean ± SEM. *p < 0.05, **p < 0.01, ***p < 0.001. ns, not significant. See also Figure S4.
