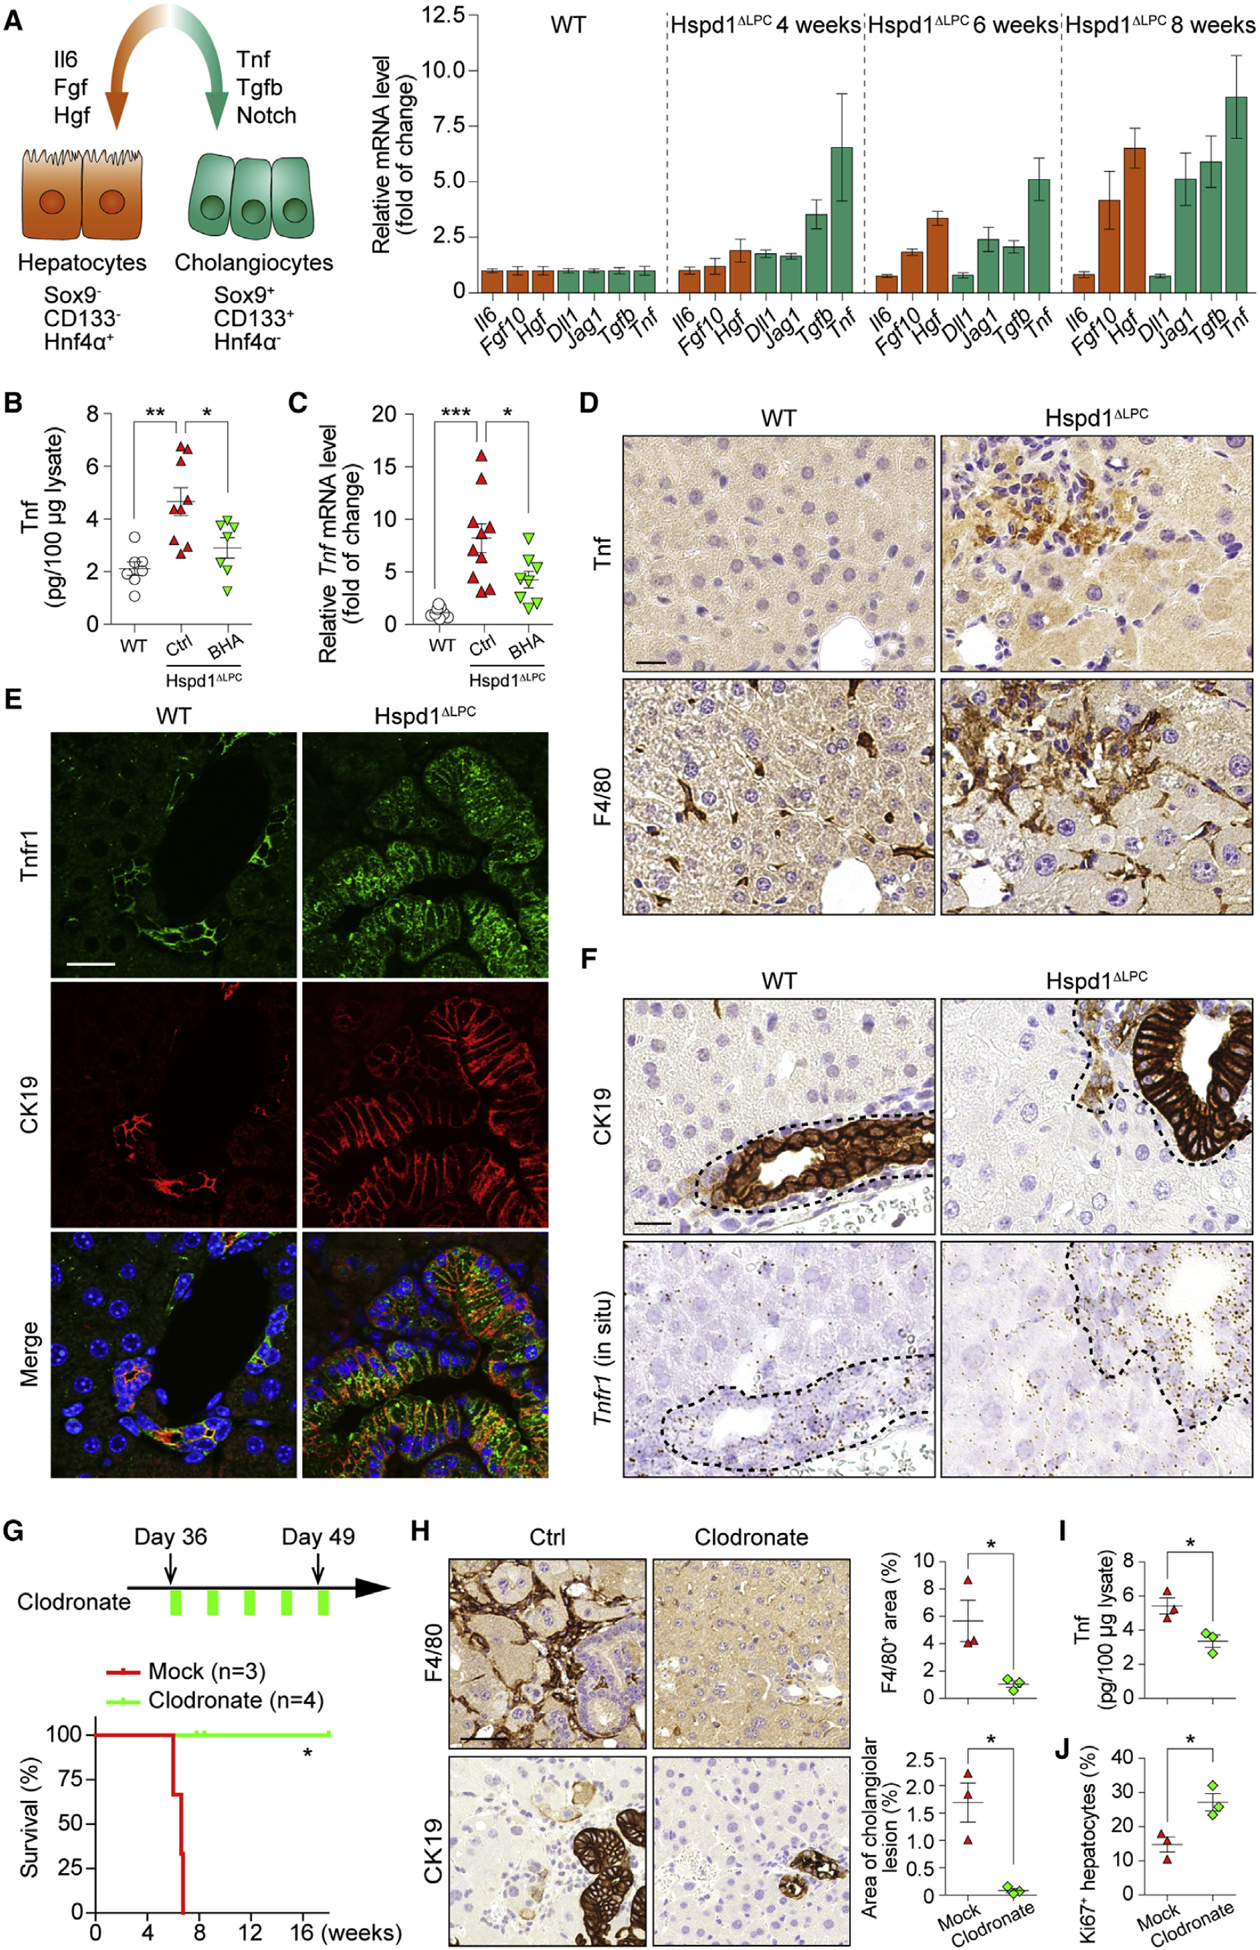
Figure 4. Kupffer Cells Promote Cholangiocellular Tumorigenesis.

(A) Left: schematic of key signals regulating hepato- or cholangiocellular proliferation. Right: qRT-PCR of Hspd1ΔLPC livers at different ages for the expression of key ligands.
(B and C) Tnf ELISA (B) and qRT-PCR (C) of WT and normal versus BHA diet 8-week-old Hspd1ΔLPC livers.
(D) Tnf and F4/80 IHC in consecutive sections of 8-week-old Hspd1ΔLPC and WT livers. Scale bar, 20 μm.
(E) Immunofluorescence (IF) of Tnfr1 and CK19 in 8-week-old Hspd1ΔLPC and WT livers. Scale bar, 20 μm.
(F) CK19 IHC and Tnfr1 in situ hybridization in consecutive sections from 8-week-old Hspd1ΔLPC and WT livers. The dashed lines indicate the border between bilary cells and hepatocytes. Scale bar, 20 μm.
(G) Upper: timeline of clodronate administration on Hspd1ΔLPC mice. Lower: survival plot for Hspd1ΔLPC mice treated with mock or clodronate.
(H) F4/80 and CK19 IHC in consecutive sections from 8-week-old Hspd1ΔLPC livers treated with mock or clodronate. Quantification of each staining was shown in the right panels. Scale bar, 50 μm.
(I) Tnf ELISA from 8-week-old Hspd1ΔLPC livers treated with mock or clodronate.
(J) Quantification of Ki67+ hepatocytes in Hspd1ΔLPC livers treated with mock or clodronate.
Data are represented as the mean ± SEM. *p < 0.05, **p < 0.01, ***p < 0.001. ns, not significant. See also Figure S5.
