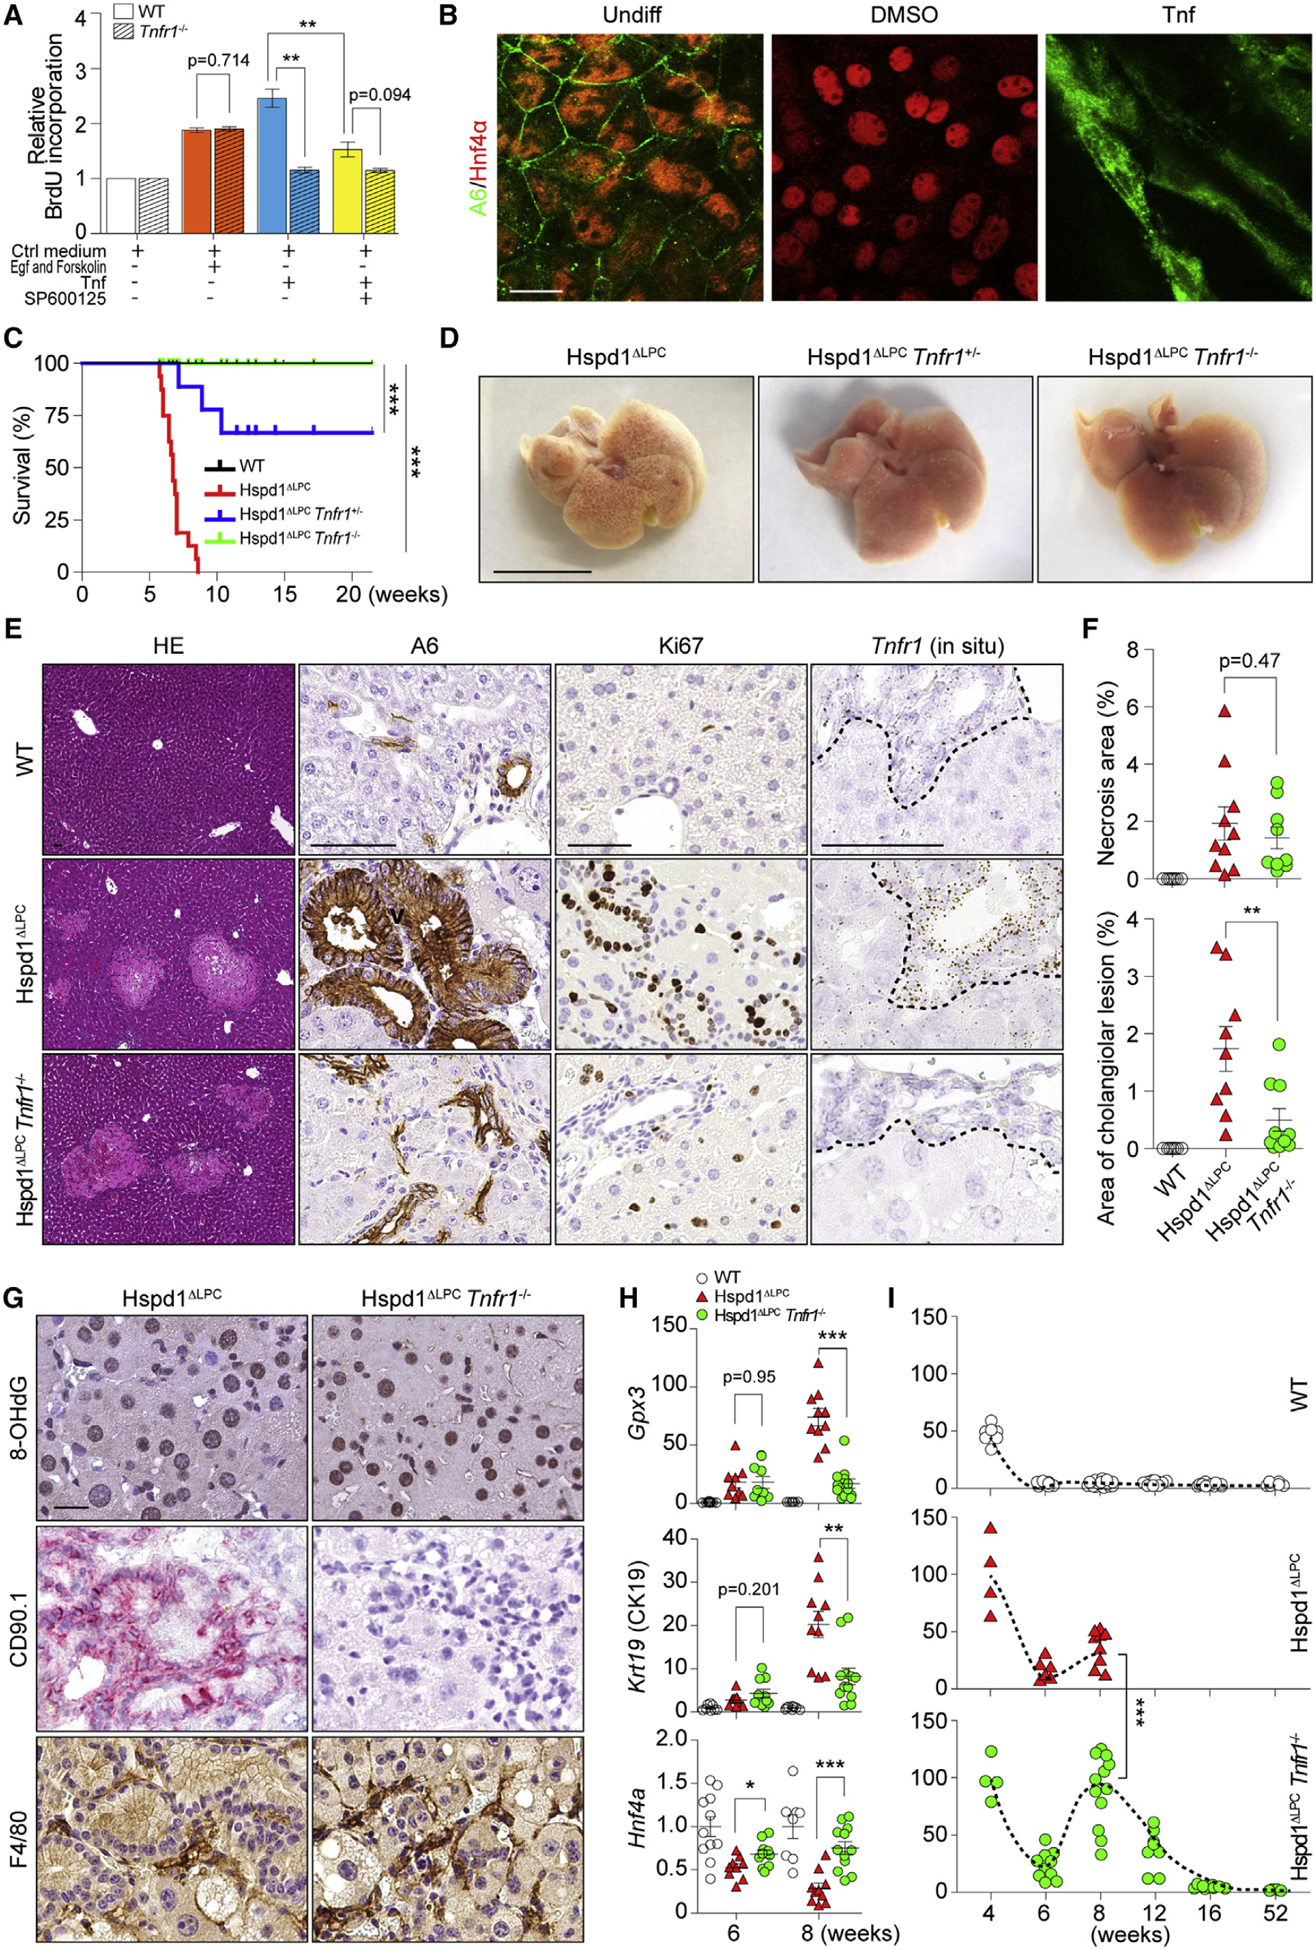
Figure 5. Tnfr1 Signaling Promotes Premalignant Cholangiocellular Lesions.

(A) Cell proliferation of WT or Tnfr1−/− cholangiocytes was analyzed by bromodeoxyuridine (BrdU) incorporation.
(B) Hepatoblasts were kept in basal medium or basal medium supplemented with DMSO or Tnf. IF of A6 and Hnf4α was performed. Scale bar, 20 μm.
(C) Survival analysis for Hspd1ΔLPC, Hspd1ΔLPC Tnfr1+/−, and Hspd1ΔLPC Tnfr1−/− mice.
(D) Macroscopic appearance of 8-week-old Hspd1ΔLPC, Hspd1ΔLPC Tnfr1+/−, and Hspd1ΔLPC Tnfr1−/− livers. Scale bar, 1 cm.
(E and F) H&E, A6 and Ki67 IHC, and Tnfr1 in situ hybridization of 8-week-old WT, Hspd1ΔLPC, and Hspd1ΔLPC Tnfr1−/− livers (E), as well as quantification of necrosis and cholangiocellular overgrowth (F). The dashed lines indicate the border between bilary cells and hepatocytes. Scale bar, 50 μm.
(G) IHC of 8-week-old Hspd1ΔLPC and Hspd1ΔLPC Tnfr1−/− livers. Scale bar, 20 μm.
(H) qRT-PCR of 6- and 8-week-old WT, Hspd1ΔLPC, and Hspd1ΔLPC Tnfr1−/− livers for indicated genes.
(I) Percentage of Ki67+ hepatocytes in WT, Hspd1ΔLPC, and Hspd1ΔLPC Tnfr1−/− livers.
Data are represented as the mean ± SEM. *p < 0.05, **p < 0.01, ***p < 0.001. ns, not significant. See also Figure S5.
