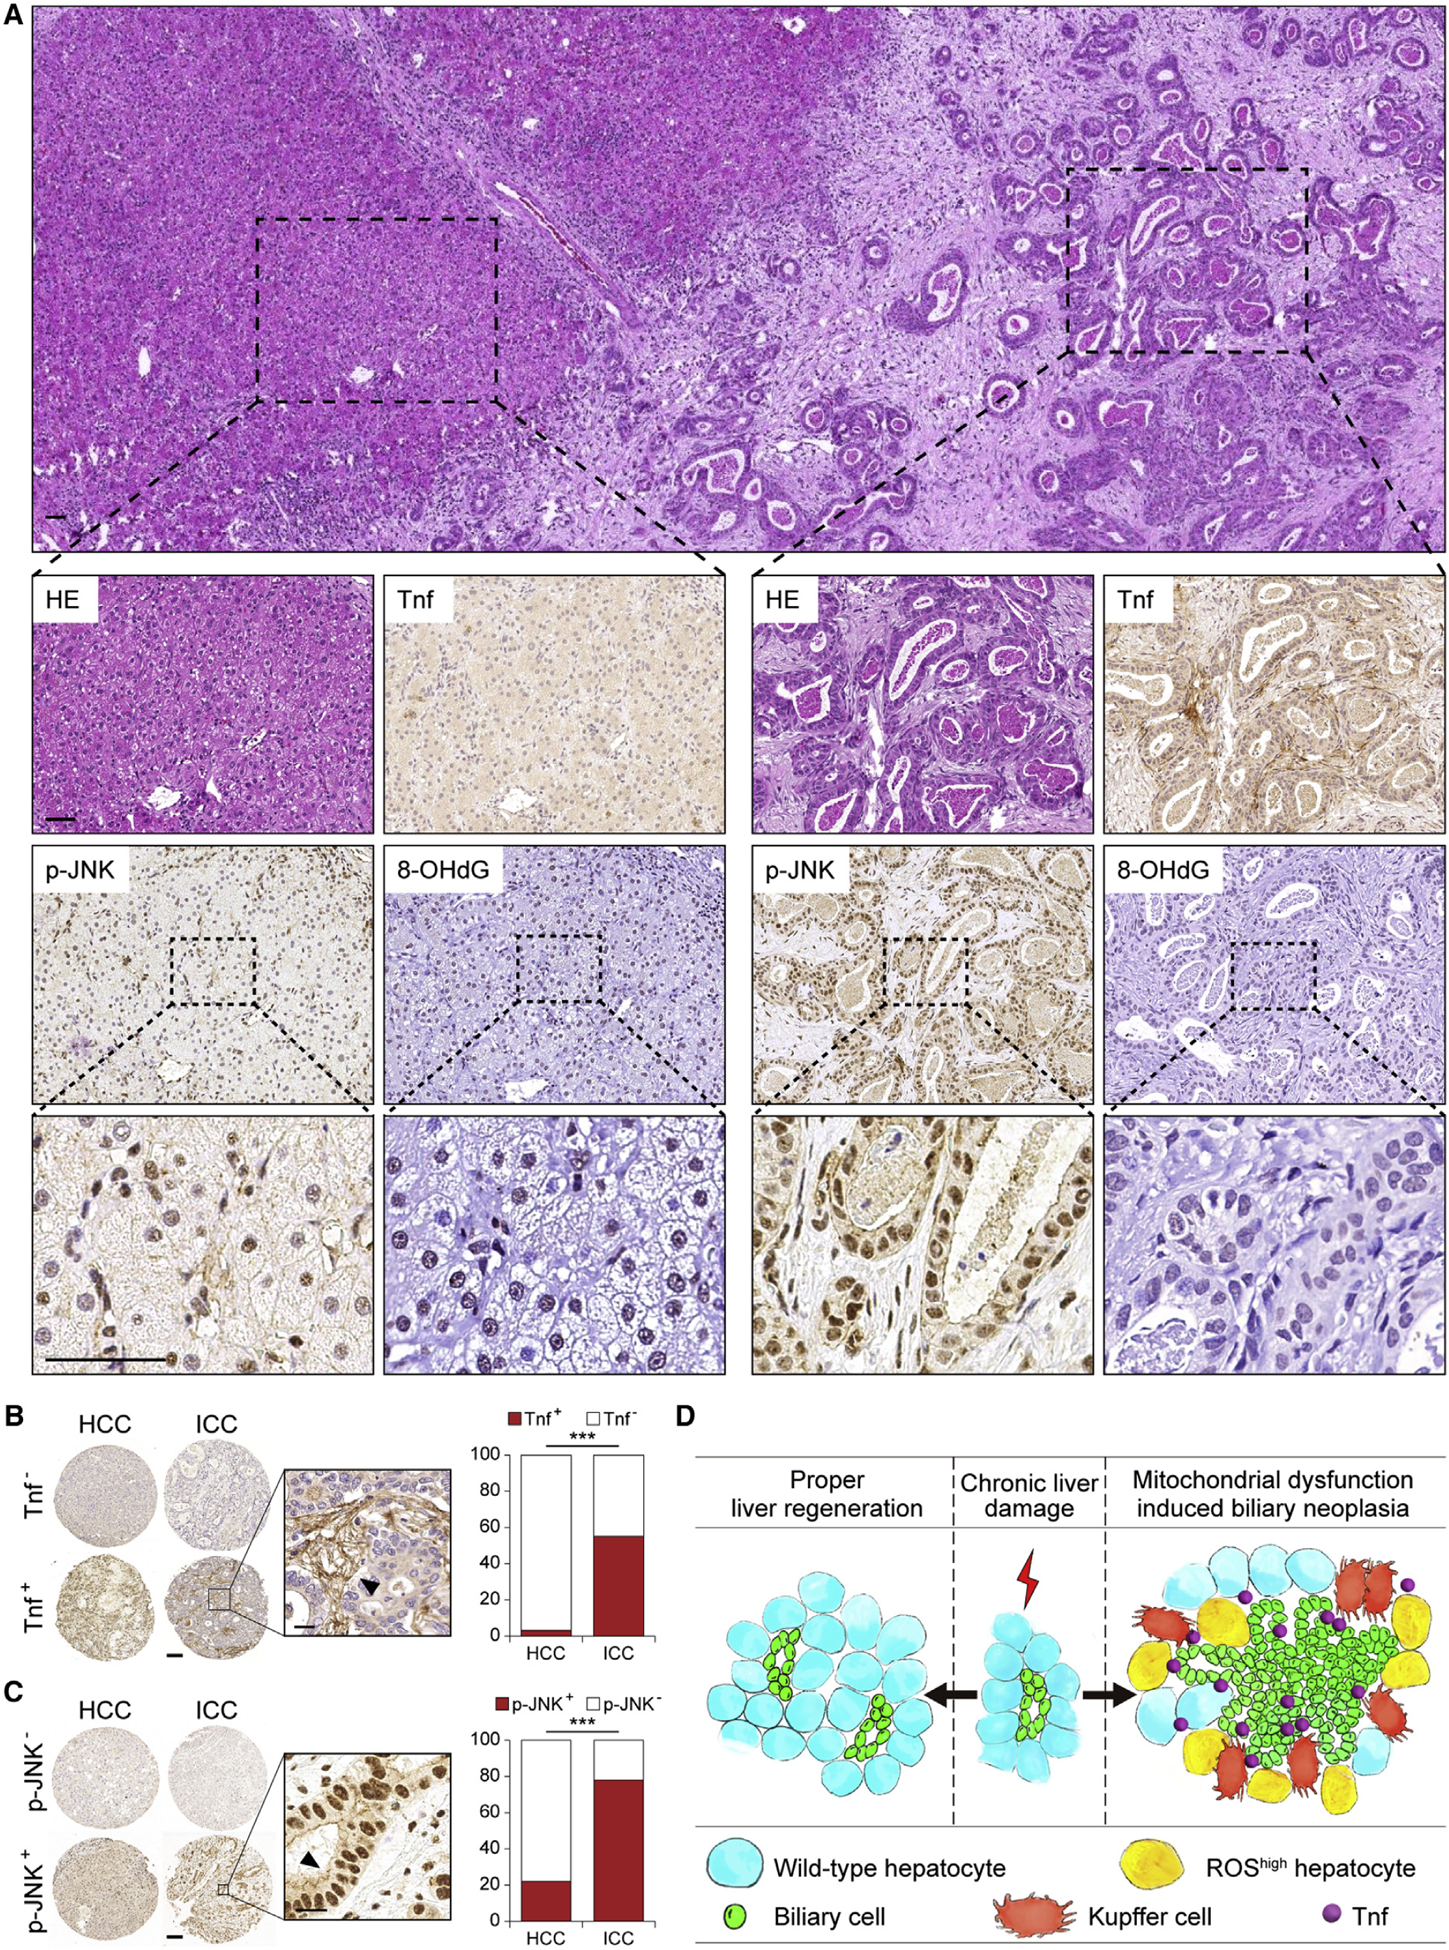
Figure 8. Tnf and p-JKN Are Strongly Increased in ICC Patient Specimens.

(A) H&E and IHC staining of Tnf, p-JNK, and 8-OHdG in a representative human ICC sample. Scale bar, 50 μm.
(B and C) Representative IHC images and quantification of Tnf (B) and p-JNK (C) in human ICC and HCC. Arrowheads indicate positive staining. Scale bars, 100 μm (left), 20 μm (right).
(D) Model depicting a non-cell-autonomous mechanism of hepatocyte mitochondrial dysfunction in regulating cholangiocellular tumorigenesis.
***p < 0.001. ns, not significant. See also Figure S8.
