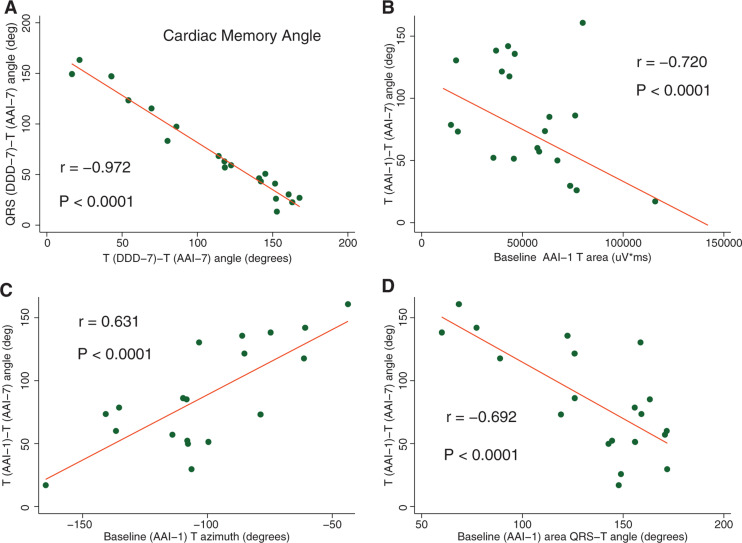
Figure 3:
Repolarization memory. A: Scatterplot of QRSDDD-7–TAAI-7 angle (y-axis) against the TDDD-7–TAAI-7 angle (x-axis). B–D: Scatterplots of TDDD-7–TAAI-7 angle (y-axis) against the TAAI-1 area (x-axis), TAAI-1 azimuth (x-axis), and QRS–TAAI-1 angle, respectively. A linear best-fit line is shown.

