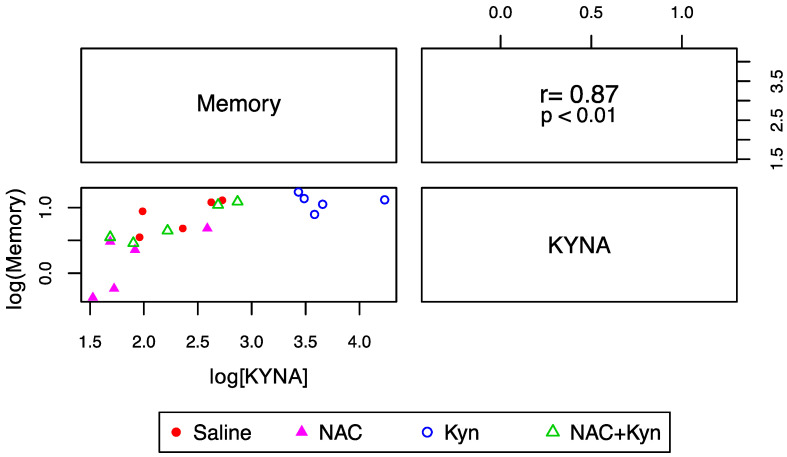
Figure 6.
Correlation between KYNA levels and memory performance. The lower triangular matrix contains the scatterplot for KYNA (fmoles/mg tissue) and the time (seconds) the animal spends to find the target (memory). The upper triangular matrix contains the Spearman’s rank correlation coefficient (r) and its associated p-value (p) (n = 5 per group).

