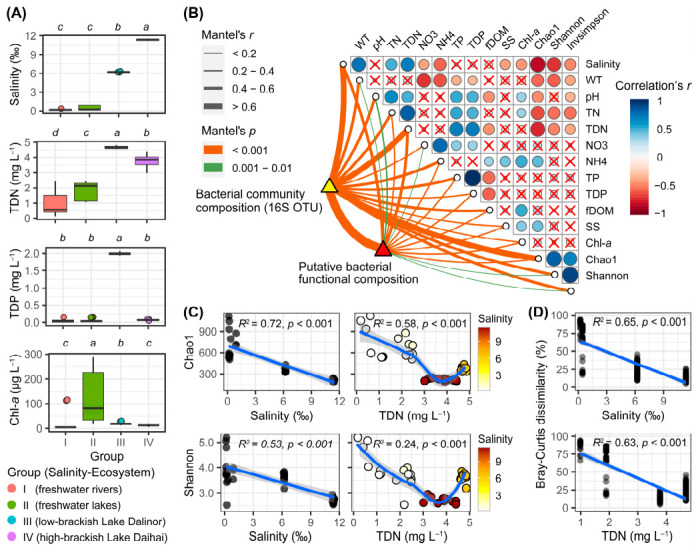
Figure 2.

Main environmental parameters, and the diversity of bacterial communities, among the four habitat groups based on salinity gradients and ecosystem types. (A) Boxplot comparison of the four main environmental parameters among the four groups, using Kruskal–Wallis test to examine the significant levels of the differences. Above each panel, the different lower-case letters indicate significant differences (p < 0.05) among different groups. TDN, total dissolved nitrogen; TDP, total dissolved phosphorus; Chl-a, chlorophyll-a. (B) Pearson’s correlation coefficients of the main 12 environmental factors, the three bacterial diversity indices (Chao1, Shannon, Invsimpson), bacterial community composition, and predicted bacterial functional composition using Mantel tests. Circle size corresponds to the value of the correlation coefficients. Circles with a cross denote the statistically non-significant pairwise correlations. Line width corresponds to the Mantel’s r statistic for the corresponding distance correlations, and line color denotes the statistical significance based on 9999 permutations. (C) Regression of bacterial α-diversity indices Chao1 and Shannon using salinity and TDN. The linear or LOESS fits were performed with the solid blue lines, while the grey shaded areas represent 95% confidential intervals. The adjusted R2 and significance p-values are presented in each panel using a linear model. In the right panels, the color gradients represent salinity. (D) Regression of bacterial β-diversity (Bray–Curtis dissimilarity) using salinity and TDN. Each circle represents the Bray–Curtis dissimilarity values between two samples in each habitat group, using the average values of salinity and TDN in each habitat group as the values in x-axis.
