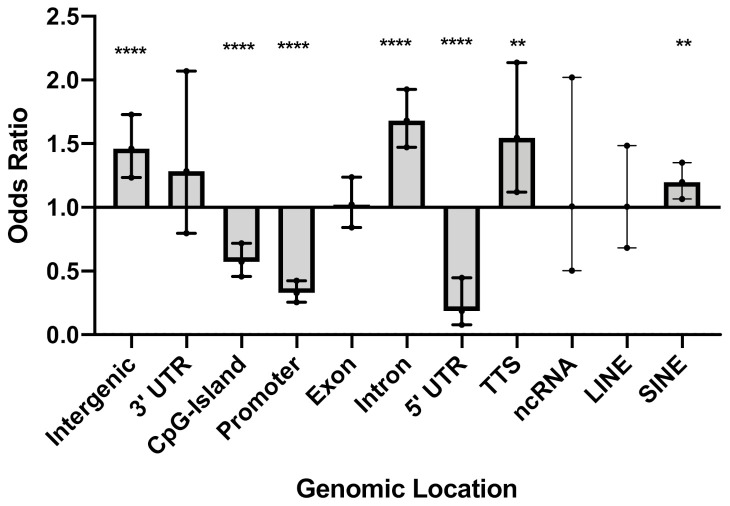
Figure 1.
Genomic location of differentially methylated CpGs (DMC) that met an adjusted p-value < 0.4. Odds ratio (OR), 95% confidence intervals (CI), and p-values were computed against the general distribution of the 3,870,251 CpGs of our dataset using GraphPad Prism v9. Error bars represent the 95% CI. OR indicates the enrichment or depletion of DMCs in each region. Transcription termination site (TTS); non-coding RNA (ncRNA); long interspersed nuclear elements (LINE); short interspersed nuclear elements (SINE). ** p ≤ 0.01, **** p ≤ 0.0001.

